Author Archives: Geothink

GIS & the Global Community: Humanitarian Mapping

Image of KLL team on balcony of new headquarters

KLL team outside their new headquarters. Photo courtesy Kathmandu Living Labs.

By Naomi Bloch


Today, November 18, marks the 16th annual GIS Day. Throughout the week, Geothink has been presenting a series of posts looking at some of the ways in which our collaborators, partners, and friends around the world are critically examining and using GIS as a tool for civic engagement and understanding.
The community snapshots presented this week highlight diverse perspectives and uses for GIS. We conclude our series with the following piece on humanitarian mapping and OpenStreetMap.

This past March, Nama Budhathoki, a long-time contributor to OpenStreetMap, announced his candidacy for the Humanitarian OpenStreetMap Team (HOT) Board of Directors. Budhathoki, the executive director of Nepal’s Kathmandu Living Labs (KLL), posted a manifesto that — in the months following Nepal’s April 25 earthquake — seemed beyond prescient. In it, he proposed his vision for HOT, and for the crowdsourced mapping community around the world.

Budhathoki’s principal message is two-fold. 1) Humanitarian mapping can be more effective by transitioning from being primarily a reactive community to one that encourages mapping communities to develop where they’re most needed — before crisis strikes. 2) A unique benefit of crowdsourced mapping stems from its role in community engagement and capacity building.

OpenStreetMap’s U.S. Chapter is a Geothink partner. Geothink recently caught up with Budhathoki while he was visiting Washington D.C. as the invited featured speaker at the launch of Mapping for Resilience: Turning Data into Decisions, a new program that aims to support geospatial data development in areas of need using OpenStreetMap.
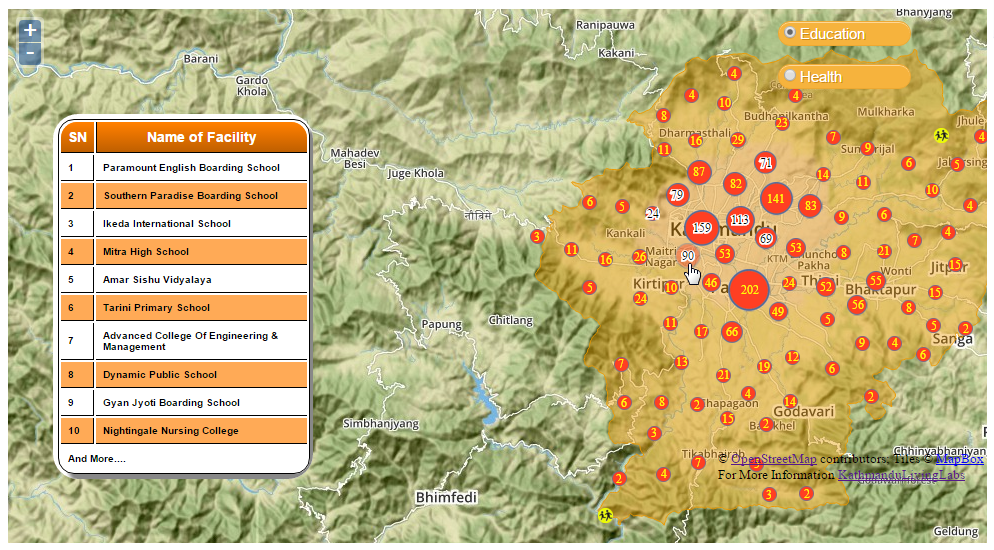
Mapping as civic engagement

The challenge that KLL has been addressing for several years now in Kathmandu is the lack of decent spatial data and maps for the region. The small team has been tackling the problem by collaborating with educational institutions in Nepal, training students how to map their local environment in OpenStreetMap. In 2013, for example, they went out into the field to collect exposure data at the individual building level for over 2,000 schools, colleges and universities, as well as 350 health facilities in Kathmandu Valley. They mapped this data on OpenStreetMap so that the information could be downloaded and used by government and other organizations developing risk assessments and plans.

For Budhathoki, the act of mapping is a mechanism for engaging citizens and building local knowledge and awareness. “I keep emphasizing this, but I can’t stress it enough. Mapping is not just about the final product — you know, the map itself. The act of mapping is important; it’s about engaging the community,” Budhathoki said. “In the process of conducting these activities, you are talking to people in the community, sensitizing them to the issues, preparing them in advance to think about it.”

Budhathoki notes that one of the most important reasons to have active, capable mapping communities on the ground in high-risk regions is so that they can build trust within their communities before disaster strikes. “KLL has been working with the government, working with organizations in the community, and with different aid organizations for several years,” Budhathoki said. “So when the earthquake hit, we not only had the local knowledge and the capacity so that we could open the situation room within 24 hours of the earthquake, but we also had the trust of all these organizations. In my experience, this element of trust is very important.”

Mobilizing the global community

Within 48 hours following the first earthquake, over 1,500 mappers around the world had responded to the call to support Nepal. Kathmandu Living Labs coordinated the effort together with HOT. This October, KLL posted a timeline capturing the milestones of their six-month journey since April.

As is typically the case on crowdsourced projects, while some contributors signed on only briefly, other mappers dedicated themselves to the cause. These core mappers, Budhathoki believes, tended to be those with a longer history on OSM and HOT projects, because they typically have a better understanding of the types of commitments and challenges involved.

“In principle, because OSM is a crowdsourcing geo platform, it is by definition designed to have a low barrier to entry,” Budhathoki explained. “Anyone should be able to begin mapping. That’s in principle. But in reality, there are tasks that require more knowledge. So for example, users with more OpenStreetMap experience handle validation tasks.

“GIS experts anywhere in the world should be able to adapt to the OpenStreetMap environment even if it is new for them. For GIS experts, OSM is a pretty simple tool, generally. They can contribute expertise that is useful, that contributes to quality of the information. But not everyone is comfortable in a crowdsourced environment.”

Where local meets global

Geothink co-applicant Claus Rinner, a professor and chair of Ryerson University’s Department of Geography and Environmental Studies, coordinated several Mapping for Nepal workshops in Toronto after the first quake struck. Rinner worked with a group of students with varying degrees of mapping experience as well as local GIS professionals to help map the affected areas. Following his experiences, he posted some reflections regarding the current slippery boundaries between traditional GIS and OpenStreetMap as a crowdsourced mapping platform — and highlighted the need for more formal education opportunities that incorporate OSM as a tool. More recently, Rinner noted that high school students have been expressing an interest in Ryerson’s mapping events for Nepal. “My main observation here is that OSM/HOT mapping is a type of community activity that uses the students’ study-related expertise,” Rinner said, “rather than being something that anyone could do.”

Budhathoki sees the work of the global OSM community as valuable on a number of levels, but also highlights the importance of local knowledge. “Virtual mappers without advanced knowledge can do fundamental tasks like mapping the road network,” Budhathoki said, “but then who can provide the name of the road? It’s the local community. And different countries categorize roads differently, so it is difficult to know what road is a highway, for example. You can’t just assume this based on the width of the road.

“So, local understanding is always going to be important — particularly in these situations, where the information is needed by humanitarian organizations and is being used on the ground right away.”

If you have any questions for Nama or the KLL team, you can reach them on Twitter here: @KTMLivingLabs

To get a quick sense of KLL and OSM’s work in Nepal since April, check out the Kathmandu Living Labs: Six-Months of Earthquake Response timeline.


If you have thoughts or questions about this article, get in touch with Naomi Bloch, Geothink’s digital journalist, at naomi.bloch2@gmail.com.

GIS on Campus: Join Claus Rinner for GIS Day at Ryerson

By Naomi Bloch


This Wednesday, November 18, marks the 16th annual GIS Day. Throughout the week, Geothink will present a series of posts looking at some of the ways in which our collaborators, partners, and friends around the world are critically examining and using GIS as a tool for civic engagement and understanding.
The community snapshots presented this week highlight diverse perspectives and uses for GIS. 

If you’re looking for a way to introduce friends to the wide-ranging sphere of GIS, look no further than Toronto’s Ryerson University campus on Wednesday.

Geothink’s Claus Rinner along with GIS and Map Librarian Dan Jakubek have a full afternoon of events scheduled for GIS Day. They’ve lined up three keynote presentations, each of which will explore very different GIS applications: Senior Landscape Ecologist Dr. Namrata Shrestha will discuss her work with the Toronto & Region Conservation Authority; Andrew Lyszkiewicz from the City of Toronto’s Information & Technology Division brings in the municipal GIS perspective; while the Toronto Star’s Matthew Cole and William Davis are on hand to cover the growing role of GIS, mapping, open data, and data analysis in the media.

Apart from keynotes, there will be a poster session, geovisualization project displays, as well as several practical demonstrations of GIS and geoweb tools in action. Neptis Foundation, a Geothink partner, is one of the participating organizations. According to the Neptis Foundation’s Adrien Friesen, he and colleague Vishan Guyadeen will be demonstrating their soon-to-be-launched geoweb platform, “an integrative web mapping tool for the Greater Golden Horseshoe, created to help residents, researchers and decision makers better understand what shapes our urban and rural environments. It allows users to select different spatial layers that they can overlay and view different infrastructure, political boundaries, and protected areas (among many other things), to visualize the region in which they live.”

A full itinerary of the afternoon’s events can be found on the Geospatial Map & Data Centre website. While you’re on campus, you might want to check out the Geospatial Map & Data Centre itself. Ryerson Library’s communal lab is a dedicated space designed to support collaborative work with GIS, data, and related geospatial and statistical software packages.

Date: Wednesday, November 18, 2015
Time: 1:00 pm–5:00 pm
Location: Library Building, LIB-489, 4th Floor, 350 Victoria Street

For more of Geothink’s GIS Day coverage, see:

If you have thoughts or questions about this story, get in touch with Naomi Bloch, Geothink’s digital journalist, at naomi.bloch2@gmail.com.


GIS in the City: Toronto on the Map

Map of Toronto school nutrition program distributionBy Naomi Bloch


This Wednesday, November 18, marks the 16th annual GIS Day. Throughout the week, Geothink will present a series of posts looking at some of the ways in which our collaborators, partners, and friends around the world are critically examining and using GIS as a tool for civic engagement and understanding.
The community snapshots presented this week highlight diverse perspectives and uses for GIS. 

If you make your way to Toronto’s City Hall on Wednesday, you’ll discover that the City is displaying a slideshow of some pretty interesting maps, just above the 3D model of the downtown core. The big-screen projection, set up for Geography Awareness Week and GIS Day, showcases some of the ways that Toronto’s municipal divisions are using GIS to tackle urban issues.

These same projects can also be perused at your leisure via a new City of Toronto GIS Day landing page. The City of Toronto is one of Geothink’s municipal partners.

City of Toronto's Ventilation Index map. All images © City of Toronto 1998-2015. Used with permission.

City of Toronto’s Ventilation Index map. All images © City of Toronto 1998-2015. Used with permission.

The breadth of projects may surprise Toronto residents. Take the Environment and Energy Division’s (EED) Ventilation Index. The EED is mapping the city to get a full spatial understanding of areas known as “urban canyons,” narrow open spaces confined between built spaces that contribute to ground-level pollution — a problem most noticeable to pedestrians in the city. The higher the ventilation index, the greater the level of pollution. The Ventilation Index researchers’ goal is to try to identify “how the City’s changing building profile may have growing adverse effects at ground level and how to mitigate and adapt to the rapidly growing City.”

The City’s uses of GIS extend beyond urban planning or trying to understand how urban design impacts the environment. The Department of Public Health, for example, is employing GIS to better understand the distribution and funding of school nutrition programs. In 2014, 160,000 Toronto students participated in breakfast, snack and lunch programs, provided in schools and community sites throughout the city. Public Health has mapped the locations where student nutrition programs were in effect in 2014, with each site categorized based on the funding source behind the program. Incorporating census data such as the Low Income Measure, they’ve identified where meal programs are located relative to the City’s designated Neighbourhood Improvement Areas. This spatial mapping of school nutrition programs helps the City to understand which communities remain under-served and where additional funding should be allocated.

Want to know more about how the City of Toronto is using GIS? Head to Metro Hall on Friday, Nov. 20, anytime between 8:00 am and 3:00 pm. A few staff members from the City’s Geospatial Competency Centre will be on hand to answer questions.

For more of Geothink’s GIS Day coverage, see:

If you have thoughts or questions about this story, get in touch with Naomi Bloch, Geothink’s digital journalist, at naomi.bloch2@gmail.com.


An Expert’s View on Civic Participation on the Geoweb

By Naomi Bloch


As an early warm-up to our November 23 Twitter chat — What does meaningful civic participation on the geoweb look like? — we asked Geothink Head Renee Sieber to share her perspective. Here are a few highlights.


word cloud

More access, more communication

I think we’re in an environment where we’ve really broadened opportunities for citizens to participate through social media, through these various kinds of devices that we have, so I think it’s very exciting.

It’s an opportunity for citizens to be engaged when they don’t necessarily have the time to attend a meeting. So they can both watch city activities online through their own dashboards or they can communicate as issues arise. Perhaps cities may wish to create polls of online sentiment; they want to alert citizens of emergency situations or of interesting happenings in the city.  —R.S.


Citizen–City connection

We can have citizens more fully engaged as members of the city in reporting, in monitoring events in real-time. People generally point to open 311 applications. Open 311 comes from an old telephone service where you could dial a short number, 311, and you could report a nuisance complaint. This has moved online. So the prototypical example is the pothole. You can report the pothole, you can report a missing street sign. This can be enormously helpful to cities because they have more real-time information for problems in the infrastructure. So that’s another kind of engagement.  —R.S.


Hackathons

… Citizens can find new and unusual ways to use data that comes out of cities, in ways that cities had never thought about before. So it’s a very exciting way for people—particularly techies—to get into the mechanisms of governance and the mechanisms of government.

So I think that this is a great time to engage physically and digitally about what’s happening in your own cities. There are obviously challenges that are paired with that.  —R.S.


Digital divides

One way that we frame technology is by saying that, “It’s so easy now that anyone can participate.” The flipside of that, unfortunately, is that if you cannot participate it’s your fault: “We made it easy for you, so if you don’t want to participate — or if you cannot or you didn’t choose to participate — in that particular poll, well, we can’t be responsible if we didn’t hear your voice.”

But that ignores all sorts of reasons that people cannot participate. The digital divide and digital inequities have not gone away, they merely shift and hide. So we can be relatively sure that a lot of people have e-mail, but in parts of rural Canada we can’t always be sure that people will have sustainable connections to the Internet, to broadband connections, to connections of a sufficient speed, to connections that persist over time as opposed to connections that drop out in the middle of an e-mail transmission or a call. That’s a real challenge if all of a sudden you decide to move a good portion of your citizen activity online; you cut out a large number of people.

We may say, “Oh great, we can build all these apps for smart phones.” Well, that of course presumes that people own smart phones, that people have data plans on smart phones, that people have sufficiently high speed connections on their phones so that they can transmit, upload and download data quite quickly. We can’t make those kinds of assumptions.  —R.S.


Persistent social divides & inequities

You have to couple that with persistent digital divides and divides in general. Why are we assuming that illiteracy has been abolished in North America? We know that people still are illiterate. The hallmark of these technologies is that they’re increasingly relying on the written word. You have a phone, and you think we’re going to interact with the phone via voice. But increasingly people use their phones with text. Well, if you can’t read then you can’t participate. If you cannot see, you cannot participate. So we have all sorts of inequities based on disabilities.

So we have to be in tune to that, even as we trumpet the increased advantages and increased opportunities for people to participate. There will be people who will still find it extraordinarily challenging. Obviously people are working on solutions, but we have to be mindful of this in our rush to embracing digital engagement completely.   —R.S.


Public space meets proprietary space

In terms of technologies and processes that are shaping these conversations, obviously social media and social networks have been incredibly important. We almost take for granted now that cities have Facebook pages—that departments in cities have Facebook pages. But that’s an odd concept when you step back and you think about it. That, (a) a city should have social media, and (b) that cities need to attach themselves to a specific proprietary network.

But the fact that cities are socially engaged via these platforms, that they actually spend the resources and see the need to have Facebook pages that are updated, that they have Twitter accounts, that they have YouTube channels, that they may be increasingly looking at applications like Meerkat and Periscope to allow for live streaming—that they may be incredibly concerned that applications like Meerkat and Periscope may be used to inadvertently live stream a conversation that they heretofore thought was private—I think these technologies have rapidly transformed the way that cities feel they must now be engaged with the public.

These technologies absolutely have technological implications and they have institutional implications as well. You have to have a person who updates your Facebook accounts. That takes some time to do. You may have to find someone who automates posting not only on Facebook, but to LinkedIn, to Twitter—that automation may require a systems administrator or coder employed by the city. The fact that cities now employ social media people, these are job titles that we did not see before: open data architects, CTO [chief technology officer] positions in cities. These are processes that have changed in cities.
—R.S.


Progress is not always made to measure

I think that in the future cities will increasingly start to grapple with what succeeds and fails. I think we’re in a publishing mode right now. I think that cities are doing all they can to keep up. So, the city has to publish as much data as it can on an open data platform. They have to engage in as many social media platforms as they can. I think they will increasingly need to take hard looks at what succeeds and what fails.

It is by no means easy to evaluate these platforms in terms of success and failure. What is an effective Facebook profile? How do you measure that? Do you measure it with “likes”? OK, that’s one very technical way of measuring it, but what does a “like” tell you about meaningful engagement? It might not tell you a lot.

So it’s easy to take the low-hanging fruit of measurements to determine whether platforms are successful or not. That may not be the right way to go. Cities are increasingly looking at analytics and predictive analytics to gauge the success of these various platforms and their engagement. But once again, that tends to based on what can easily be quantified.  —R.S.


Humanizing the city

A lot of engagement between cities and citizens is much more longitudinal. It happens slowly over time. Cities and citizens build up trust. Distrust is easily gained, and very hard to get rid of.

I’ve been talking about cities as these homogeneous unions. But there are people in cities; there are citizens employed by cities, and often it is the ways that individuals in city governments reach out to individual citizens or groups of citizens, building up those linkages—using these technological platforms to heterogenize the city [that builds trust].

So, we begin to see the city and we see government as people engaging, just like you. They’re engaging with you, as opposed to being just The State (and you always must have this opinion about The State, or be in opposition to The State, or protest The State).

So [citizens can] use these technologies to sort of reach in, and stop looking at it as a monolith and more as a group of people who really are in city government because they wanted to work with citizens; they wanted to work on issues that were important and very close to the people who live in their cities.  —R.S.

 Join us for our #Geothink Twitter chat on civic participation on the geoweb: Monday, November 23 at 1 p.m. Eastern Time.

GIS in the Classroom: Geography and the Law

GIS DayBy Naomi Bloch


This Wednesday, November 18, marks the 16th annual GIS Day. Throughout the week, Geothink will present a series of posts looking at some of the ways in which our collaborators, partners, and friends around the world are critically examining and using GIS as a tool for civic engagement and understanding.
The community snapshots presented this week highlight diverse perspectives and uses for GIS. 

Tenille Brown headshot

Tenille Brown, Ph.D. candidate in the University of Ottawa’s Faculty of Law

In the winter 2016 term, Geothink’s Tenille Brown, a Ph.D. candidate in the University of Ottawa’s Faculty of Law, will be teaching a new course called Law and Geography. The seminar course will be offered as a first-year elective option for J.D. students. “It’s really exciting because it will be the first law and geography course in a Faculty of Law in Canada that I am aware of,” said Brown.

The intention of the course is to introduce new law students to the emerging field of legal geography, which focuses on spatial and place-based aspects of law and legal regulation. The course description highlights several focus areas, including public and private spaces; property and the city; critical perspectives of identity, racism and the law; gender, property and the law; indigenous peoples and the environment; and globalization. “There’s a wide variety of topics,” said Brown, “and within that I have a couple of classes which will look at issues of GIS and a lot of the themes of Geothink in relation to legal geography scholarship and in relation to the law.”

Brown notes that GIS is addressed in the legal literature to some extent, but such discussion is in its nascent stages. For example, the field of technology law deals with liability issues in relation to GIS, and issues such as copyright and privacy. “And there’s a little bit of GIS analysis in relation to understanding crime, and criminality,” said Brown. “That’s a big area of research, but I think there are many, many, many GIS narratives which are not captured at all.”

All of these GIS-oriented legal issues will play a role in her course, however she’s also hoping to draw in some students who have previous practical experience with GIS technologies. “If there are students who have a particular interest in GIS or have skills in GIS, and they’re willing, then we can explore not just legal liability in relation to GIS but also, how can we use GIS to help the functioning of the legal system? So really opening it up for those skills to be brought into the classroom.”

“I’m interested in knowing how information about a place, which is maybe more than property-related, can influence how we regulate or understand a particular area of a city, for example,” Brown said. “How can we bring in different information about a city that is not captured by a property title deed, or a traditional survey that we might have? We see a lot of non-traditional information collection right now. That is, it’s non-traditional from a legal perspective — information about how people use a place. Typically the law doesn’t care about that. Typically the law just wants to know who has the title deed, and that’s it.”

Brown offers the example of First Nations groups in Canada, who are currently using GIS and GIS technologies to collect oral histories and map out their histories spatially. “There’s a big push from indigenous communities, and a willingness and a desire to engage with GIS technologies to capture these different narratives,” Brown said. “And they’re wanting to use it to support land claims. That’s their whole aim.

“So it’s important to figure out how modern information can be incorporated into a legal system which relies on historical treaties,” Brown explained. “There’s a lot of legal questions about using that information and the strength of that kind of information from an evidentiary perspective. The law has a very non-GIS approach — a non-tech approach — to adjudication. So I think one of the really important questions is, how can we get this modern GIS counter-narrative and make sure that it’s solid as evidence that is effective for the legal system?”

For Brown, encouraging students with a GIS or geography background to consider how their knowledge can contribute to the legal process is just one motivation for her course. “They’re first-year law students,” Brown said,  “so they’re just beginning to get to grips with what takes place in the Faculty of Law. They’re in shock a little bit, at this point. With this class, I’m really hoping to open it up for students that already have an undergraduate degree in something spatial-related. If there’s anyone who’s done work with GIS, that will definitely enrich the classes.”

Do you have questions about Tenille’s course or research? Contact her on Twitter at: @TenilleEBrown 
Tenille Brown is a PhD candidate in the Faculty of Law at the University of Ottawa. She is a Geothink student member, and a member of the university’s Human Rights Research and Education Centre. Her research is in the areas of legal geography, including property, spatial and citizen engagement in the Ottawa context.


For more of Geothink’s GIS Day coverage, see:

If you have thoughts or questions about this article, get in touch with Naomi Bloch, Geothink’s digital journalist, at naomi.bloch2@gmail.com.

Moving Forward with Canadian Census Data

By Naomi Bloch


Chloropleth maps of National Household Survey global non-response data at the dissemination-area level courtesy Scott Bell. Global non-response rates > 50% resulted in suppression of data for that spatial unit. All maps are classified using a quantile classification scheme.


As we move forward (and backward) with the 2016 return of Canada’s long-form census, questions remain for everyone who uses Statistics Canada’s key socio-economic data. Researchers, local government agencies, community organizations, and industry will still need to use data collected via the 2011 National Household Survey and understand how to reconcile that information with long-form census data.

Concerns regarding the reliability of NHS data stem from the lower response rates that resulted from the non-mandatory nature of the 2011 survey. The overall response rate for the survey decreased from 94 percent in 2006 to 69 percent in 2011. Media attention has centred on the fact that Statistics Canada chose not to release survey data for 25 percent of all census subdivisions because response rates for those spatial units were too low. A key question is whether the regions for which we have no reliable data share certain socio-economic characteristics — and if so, how this might impact service provision.

Geothink co-applicant researcher Scott Bell, a professor of Geography and Planning at University of Saskatchewan, has been studying and mapping the spatial patterns of the National Household Survey’s global non-response rates. His work examines various geographic levels, and considers response rate patterns relative to several socio-economic variables. Bell found that across the 15 cities he studied, there are many commonalities between areas where response rates are similar.

In this video interview, Bell discusses his research and its implications.

For more from Scott Bell, see also: The Long-term Impacts of the Short-Lived National Household Survey

If you have thoughts or questions about this video interview, get in touch with Naomi Bloch, Geothink’s digital journalist, at naomi.bloch2@gmail.com.

Geothink Student Evan Hamilton Explores Canadian Municipal Open Data and the Role of Journalism

headshot of Evan Hamilton

Geothink student Evan Hamilton recently defended his master’s thesis on Toronto data journalists’ use of open data.

By Naomi Bloch

Data journalists are some of the most active users of government open data in Canada. In his recently defended thesis, Evan Hamilton, a master’s student in the University of Toronto’s Faculty of Information, examined the role of data journalists as advocates, users, and producers of open data.

Hamilton’s thesis, titled “Open for reporting: An exploration of open data and journalism in Canada,” addressed four research questions:

  1. Are open data programs in Ontario municipalities developing in a way that encourages effective business and community development opportunities?
  2. How and why do journalists integrate open data in reporting?
  3. What are the major challenges journalists encounter in gaining access to government data at the municipal level?
  4. How does journalism shape the open data development at both the policy level and the grassroots level within a municipality?

To inform his work, Hamilton conducted in-depth, semi-structured interviews with three key data journalists in the City of Toronto: Joel Eastwood at the Toronto Star, William Wolfe-Wylie at the CBC, and Patrick Cain at Global News. While open data is often touted as a powerful tool for fostering openness and transparency, in his paper Hamilton notes that there is always the risk that “the rhetoric around open data can also be employed to claim progress in public access, when in fact government-held information is becoming less accessible.”

In an interview with Geothink, Hamilton explained that the journalists made important distinctions between the information currently available on Canadian open data portals and the information they typically seek in order to develop compelling, public-interest news stories. “One of the big things I took away from my interviews was the differentiation that journalists made between Freedom of Information and open data,” said Hamilton. “They were using them for two completely different reasons. Ideally, they would love to have all that information available on open data portals, but the reality is that the portals are just not as robust as they could be right now. And a lot of that information does exist, but unfortunately journalists have to use Freedom of Information requests to get it, which is a process that can take a lot of time and not always lead to the best end result.”

Legal provisions at various levels of government allow Canadians to make special Freedom of Information requests to try to access public information that is not readily available by other means. A nominal fee is usually charged. In Toronto, government agencies generally need to respond to such requests within 30 days. Even so, government responses do not always result in the provision of usable data, and if journalists request large quantities of information, departments have the right to extend the 30-day response time. For journalists, a delay of even a few days can kill a story.

While the journalists Hamilton interviewed recognized that open data portals were limited by a lack of resources, there was also a prevailing opinion that many government agencies still prefer to vet and protect the most socially relevant data. “Some were very skeptical of the political decisions being made,” Hamilton said. “Like government departments are intentionally trying to prevent access to data on community organizations or data from police departments looking at crime statistics in specific areas, and so they’re not providing it because it’s a political agenda.”

Data that helps communities

In his thesis, Hamilton states that further research is needed to better understand the motivations behind government behaviours. A more nuanced explanation involves the differing cultures within specific municipal institutions. “The ones that you would expect to do well, do do well, like the City of Toronto’s Planning and Finance departments,” Hamilton said. “Both of them provide really fantastic data that’s really up-to-date, really useful and accessible. They have people you can talk to if you have questions about the data. So those departments have done a fantastic job. It’s just having all the other departments catch up has been a larger issue.”

An issue of less concern to the journalists Hamilton consulted is privacy. The City’s open data policy stresses a balance between appropriate privacy protection mechanisms and the timely release of information of public value. Hamilton noted that in Toronto, the type of information currently shared as open data poses little risk to individuals’ privacy. At the same time, the journalists he spoke with tended to view potentially high-risk information such as crime data as information for which public interest should outweigh privacy concerns.

Two of the three journalists stressed the potential for data-driven news stories to help readers better understand and address needs in their local communities. According to Hamilton’s thesis, “a significant factor that prevents this from happening at a robust level is the lack of data about marginalized communities within the City.”

The journalists’ on-the-ground perspective echoes the scholarly literature, Hamilton found. If diverse community voices are not involved in the development of open data policies and objectives, chances for government efforts to meet community needs are hampered. Because of their relative power, journalists do recognize themselves as representing community interests. “In terms of advocacy, the journalists identify themselves as open data advocates just because they have been the ones pushing the city for the release of data, trying to get things in a usable format, and creating standard processes,” Hamilton said. “They feel they have that kind of leverage, and they act as an intermediary between a lot of groups that don’t have the ability to get to the table during negotiations and policy development. So they’re advocating for their own interests, but as they fulfill that role they’re advocating for marginalized communities, local interest groups, and people who can’t get to the table.”

Policy recommendations

Hamilton’s research also pointed to ways in which data journalists can improve their own professional practices when creating and using open data. “There needs to be more of a conversation between journalists about what data journalism is and how you can use open data,” Hamilton said. “When I talked to them, there was not a thing like, ‘Any time you use a data set in your story you cite the data set or you provide a link to it.’ There’s no standard practice for that in the industry, which is problematic, because then they’re pulling numbers out of nowhere and they’re trusting that you’ll believe it. If you’re quoting from a data set you have to show exactly where you’re getting that information, just like you wouldn’t anonymize a source needlessly.”

While Hamilton concentrated on building a picture of journalists’ open data use in the City of Toronto, his findings resulted in several policy recommendations for government agencies more broadly. First, Hamilton stressed that “as a significant user group, journalists need to be consulted in a formal setting so that open data platforms can be better designed to target their specific needs.” This is necessary, according to Hamilton, in order to permit journalists to more effectively advocate on behalf of their local communities and those who may not have a voice.

Another recommendation is aimed at meeting the needs of open data users who have different levels of competency. Although he recognizes the challenges involved, in his concluding chapter Hamilton writes, “Municipal governments need to allocate more resources to open data programs if they are going to be able to fulfill the needs of both a developer class requiring technical specifications, and a general consumer class that requires tools (for example. visualizations and interactives) to consume the data.”

Finally, Hamilton recommends that municipalities engage in more formal efforts “to combat internal culture in municipal departments that are against publishing public information. Data should be viewed as a public service, and public data should be used in the public interest.”

If you have any questions for Evan, reach him on Twitter here: @evanhams


Evan Hamilton successfully defended his Master of Information thesis on September 29 at the Faculty of Information, University of Toronto. His work was supervised by Geothink co-applicant researcher Leslie Regan Shade, associate professor in the University of Toronto’s Faculty of Information. Other committee members included University of Toronto’s Brett Caraway and Alan Galey (chair), as well as April Lindgren, an associate professor at Ryerson University’s School of Journalism and founding director of the Ryerson Journalism Research Centre, a Geothink partner organization.

 Abstract

This thesis describes how open data and journalism have intersected within the Canadian context in a push for openness and transparency in government collected and produced data. Through a series of semi-structured interviews with Toronto-based data journalists, this thesis investigates how journalists use open data within the news production process, view themselves as open data advocates within the larger open data movement, and use data-driven journalism in an attempt to increase digital literacy and civic engagement within local communities. It will evaluate the challenges that journalists face in gathering government data through open data programs, and highlight the potential social and political pitfalls for the open data movement within Canada. The thesis concludes with policy recommendations to increase access to government held information and to promote the role of data journalism in a civic building capacity.

Reference: Hamilton, Evan. (2015). Open for reporting: An exploration of open data and journalism in Canada (MI thesis). University of Toronto.

If you have thoughts or questions about this article, get in touch with Naomi Bloch, Geothink’s digital journalist, at naomi.bloch2@gmail.com.

The Long-term Impacts of the Short-lived National Household Survey

Tweet

By Naomi Bloch

On November 5, Navdeep Bains, Canada’s new Minister of Innovation, Science and Economic Development (now that’s a mouthful!) confirmed the rumours that the country’s mandatory long-form census will be reinstated in 2016.

But what are the long-term consequences of the interruption in mandatory data collection caused by 2011’s National Household Survey (NHS)? How significant is this short-lived census change likely to be?

Geothink co-applicant researcher Scott Bell, a professor of Geography and Planning at University of Saskatchewan, has been studying and mapping the spatial patterns of the voluntary National Household Survey data, comparing global non-response rates in metropolitan and non-metropolitan areas across the country. After today’s official announcement, Bell shared a few preliminary thoughts based on his research.

profile photo of Scott Bell

Scott Bell is a professor in the Department of Geography and Planning at the University of Saskatchewan.

Geothink: Now that the mandatory long-form census has been re-instated, is there anything that researchers or others who rely on location-based specifics from census data need to keep mind?

Scott Bell: In my own research I have been relying on 2006 data for much longer than I would have if the 2011 survey had been the long form of the census. The NHS misrepresents different parts (and types of parts) of the country. In my analysis of 15 Canadian cities, there were lower response rates (measured by non-response) in places with low income, aboriginal populations, new immigrants, and lower rates of education. This is quite troubling since the only solution Stats Canada had at their disposal was over sampling in such areas, which might exacerbate the bias.

Geothink: Did you find that your own recent research was impacted by the 2011 data, and are there likely to be any long-term implications for researchers, given that just one survey period was affected?

Scott Bell: Yes, I was compelled to use long-form data from 2006. It is a relief that we will have a return of this data for 2016. I have always appreciated Canada’s five-year census cycle and a 10-year wait is going to be OK, this once. But there will be a persistent problem trying to understand our society between 2011 and 2016 that won’t be true of another five-year period. Our understanding of economics, household mobility, finances, and structure, immigration, education, etc. for the period from 2011 to 2016 is diminished.

Geothink: Are there any important considerations to keep in mind, for those integrating data from 2011 and other periods?

Scott Bell: In work I hope to publish in the next six months, patterns of response (actually non-response) and what social and economic variables predict this non-response will be elucidated. The next step might be the development of tools to adjust NHS values in order to make the data collected more reliable. The most important step in this direction will be the collection of the long form in 2016; that data will be useful in establishing estimates of what 2011 values are valid and perhaps allow for the setting of “correction factors” for egregious rates of non-response.

Stay tuned for more detailed insights from Scott Bell on location-specific considerations of the National Household Survey data, coming soon to Geothink.ca.

If you have thoughts or questions about this article, get in touch with Naomi Bloch, Geothink’s digital journalist, at naomi.bloch2@gmail.com.