Author Archives: Geothink

Geothink at the Spatial Knowledge and Information Canada conference

By Suthee Sangiambut

This past February, we had the pleasure of viewing new research from Geothink academics and students at the Spatial Knowledge and Information (SKI) Canada conference in Banff, Alberta. This two-day conference is special as it addresses a variety of issues ranging from Geographic Information Systems (GIS) techniques and tool-building to applied spatial statistics, particularly in the context of Canadian social issues.

Geothink Head, Dr. Renee Sieber, delivered the keynote address. She spoke on the “10 Things You Should Know About Engagement, Volunteerism, and Participation in Geospatial Technologies” and gave insights on how social theory and geospatial technologies coexist. She cautioned against treating technology as a black box and taking technical tools for granted, particularly if we do not completely understand them. Application of technology does not necessarily result in more or better participation. This is one of the potential issues of the drive towards data-driven decision making, particularly if we dispense with processes of democratic participation.

This year, Geothink co-applicant Dr. Scott Bell (University of Saskatchewan) presented findings on Local patterns of national household survey non-response in Canadian cities. He highlighted methodological issues with government collection of census data, such as the Global Non-response Rate (GNR) variable. Some cities which are very small but with a high GNR can be excluded from the final results due to issues of spatial autocorrelation and edge effects. City growth is also problematic for normalising census data to make comparisons, particularly when different divisions grow at different rates. Dr. Bell’s research team developed a variety of models to predict non-response and found correlations of non-response rates with other social variables such as whether the respondent was a renter or aboriginal in origin.

Geothink student Lauren Arnold (University of British Columbia Okanagan) spoke of The Potential Role of Open Data for Public Engagement in Environmental Assessment. Environmental assessments are highly dependent on spatial analysis and require datasets at very large spatial and temporal scales to calculate and predict cumulative effects of actions for the environment, society, and economy. Open data has the potential to address issues of public participation in environmental assessments and bring in more citizen involvement, improve transparency, and potentially even decision-making. Contextualising open data within Public Participation GIS (PPGIS), Arnold argued that open data can be another catalyst for integration of PPGIS into public consultation and decision-making processes.

Suthee Sangiambut (McGill University) presented an alternative view of his Master’s research findings. Looking at open data flow in civic apps, he noted that data undergoes transformations within government, at the developer, and in between. Data transformations are often done outside of government by data re-users, but the choices government makes in how it collects or distributes data will affect data reuse down the line. He also demonstrated that open data consumed through apps are not an exact one-to-one representation of data used in government and users should be aware that open data still represents a curation of sorts.

Shelley Cook (University of British Columbia Okanagan) won joint first prize for student presentations. She presented on The Temporal and Spatial Aspects of Homeless Social Capital and gave an in-depth look at how homeless is controlled by legislative and spatial tools, such as ‘red zones’, in Kelowna, BC. She found that the size of a homeless person’s geographic footprint (their coverage of the city) is related to their social capital; smaller activity spaces allow for less social capital. Homeless geographic footprint is also inversely related to dependency on services. However, once the homeless are provided housing, their geographic footprint shrinks.

Finally, Brennan Field (University of Saskatchewan) presented on Policy Mobility of Police Interactions Open-Data. Such policies cover data collected on police interactions with the public such as vehicle stops and fines. His research will look at how these data policies are spread across jurisdictions and departments, and how they are translated to the operational level.

This 5-9 April 2017, Geothinkers will be at the American Association of Geographers (AAG) annual meeting in Boston. For a list of presentations and panels to attend, see the programme guide here. We will be tweeting for the duration of the conference on Twitter (@geothinkca).

Geothink Programme Guide for the American Association of Geographers (AAG) 2017 Annual Meeting

By Suthee Sangiambut

The Annual Meeting of the American Association of Geographers will be in Boston, MA from 5 April to 9 April 2017

The Annual Meeting of the American Association of Geographers will be in Boston, MA from 5 April to 9 April 2017

Geothink once again has a strong presence at the American Association of Geographers (AAG) Annual Meeting, this time to be held in Boston, Massachusetts, USA. Make sure not to miss two very special sessions: The Dark Side of Open Data Part One and Part Two, organized by our very own Geothink co-applicants.
See below for a compiled list of Geothink co-applicant and student presentations, discussions, and panel appearances. You can also search the programme here.

Remember to tweet at us (@geothinkca) and use #geothink and #AAG2017 conference tags.

Wednesday 5 April 08:00 – 09:40
1117 Information geographies: Social dimensions of Web 2.0 cartographies
Location: Room 206, Hynes, Second Level

08:00 Laura Garcia is presenting Are individuals responsible for their own privacy in the geoweb

Wednesday 5 April 08:00 – 09:40
1123 Emerging Field Methods for Environmental Perceptions and Behavior
Location: Room 303, Hynes, Third Level

08:00 Edward Millar is chairing the session and presenting on The Cottage Effect: Investigating Spatial Bias in Citizen Science Using a Comparative Analysis

Wednesday 5 April 12:40 – 14:20
1457 The Dark Side of Open Data – Part One
Location: Gardner A, Sheraton, Third Floor

Pamela Robinson, Peter Johnson, and Teresa Scassa are organizers. Peter Johnson is chairing the session.
12:40 Suthee Sangiambut and Laura Garcia are Interrogating the open in open data from interdisciplinary perspectives
13:00 Renee Sieber is unveiling Façades of Openness in Government
13:20 Elizabeth Judge and Tenille Brown are presenting “Tort, Open Data, and the Geoweb: A Framework for Assessing Negligence”
13:40 March Burchfield is detailing When a mandate for transparency and open data culture is not quite ready for prime time
14:00 Jon Corbett and Shelley Cook explain How open is your redlining policy? Exploring geospatial data sharing tools to improve homeless service provision in British Columbia, Canada.


Wednesday 5 April 14:40 – 16:20
1557 The Dark Side of Open Data – Part Two
Location: Gardner A, Sheraton, Third Floor

Pamela Robinson, Peter Johnson, and Teresa Scassa are organizers. Renee Sieber is chairing the session.
15:00 Peter Johnson presents on Municipal Open Data: A Slow Death?
15:20 Teresa Scassa presents Government use of georeferenced social media data and analytics: challenges for transparent and open government
15:40 Keira Webster and Pamela Robinson present Fostering the ‘Time is Now’ Mentality: the Role of Open Data in Urban Climate Resilience
16:00 Pamela Robinson presents Unlocking the Civic Potential of Open Data: Whose job is it?


Wednesday 5 April 16:40 – 18:20
1633 Spatial Decision Support Across Disciplines: Scholarship, Pedagogy and Practice
Location: Room 313, Hynes, Third Level

Rob Feick is a panellist

Thursday 6 April 15:20 – 17:00
2591 Urban-economic perspectives on technology
Location: Nantucket, Marriott, Fourth Floor

Renee Sieber is a discussant

Friday 7 April 13:20 – 15:00
3441 Big data and data privacy
Location: Liberty C, Sheraton, Second Floor

14:20 Rob Feick will speak on The spatial disconnect problem

Saturday 8 April 13:20 – 15:00
4469 Symposium on Human Dynamics in Smart and Connected Communities: Whither ‘human dynamics’ within geography?
Location: Regis, Marriott, Third Floor

Renee Sieber is a discussant

Saturday 8 April 15:20 – 17:00
4586 Trees in the City 3: Social and Ecological Influences in the Urban Forest
Location: Salon I, Marriott, Fourth Floor

16:20 James Steenberg is presenting Counter-intuitive Relationships Between Housing Renovation, Socioeconomic Status, and Urban Forest Ecosystems

Saturday 8 April 17:20 – 19:00
4638 Digital \\ Human \\ Labour 5: Panel
Location: Independence East, Sheraton, Second Floor

Renee Sieber is a discussant

Sunday 9 April 16:00 – 17:40
5583 Learning and Applying Tools in Geography: Interdisciplinary Applications of GIS
Location: Exeter, Marriott, Third Floor

Renee Sieber and Jon Corbett are panellists

A New Narrative for Collecting Statistical Data: Statistics Canada’s Crowdsourcing Project

This is a guest post from Statistics Canada on their new initiative on crowdsourcing geospatial data

Statistics Canada’s crowdsourcing project offers an exciting new opportunity for the agency to collaborate with stakeholders and citizens to produce and share open data with the general public — that is to say, data that can be freely used and repurposed.

Data collection is evolving with technology; for example, paper-based and telephone surveys are increasingly replaced with online surveys. With an array of modern technologies that most Canadians can access, such as Web 2.0 and smartphones, a new mechanism for data sharing can be piloted through open data platforms that host online crowds of data contributors. This project provides insight into how Statistics Canada can adapt these modern technologies, particularly open source tools and platforms, to engage public and private stakeholders and citizens to participate in the production of official statistics.

For the pilot project, Statistics Canada’s goal is to collect quality crowdsourced data on buildings in Ottawa and Gatineau. The data include attributes such as each building’s coordinate location, address and type of use. This crowdsourced data can fill gaps in national datasets and produce valuable information for various Statistics Canada divisions.

On September 15, 2016, Statistics Canada launched a web page and communications campaign to inform and motivate the citizens of Ottawa and Gatineau to participate in the pilot project. This pilot project is governed and developed by Statistics Canada’s Crowdsourcing Steering Committee. Statistics Canada’s communications with the local OpenStreetMap (OSM) community and collaboration with stakeholders and municipalities have allowed the pilot project to succeed.

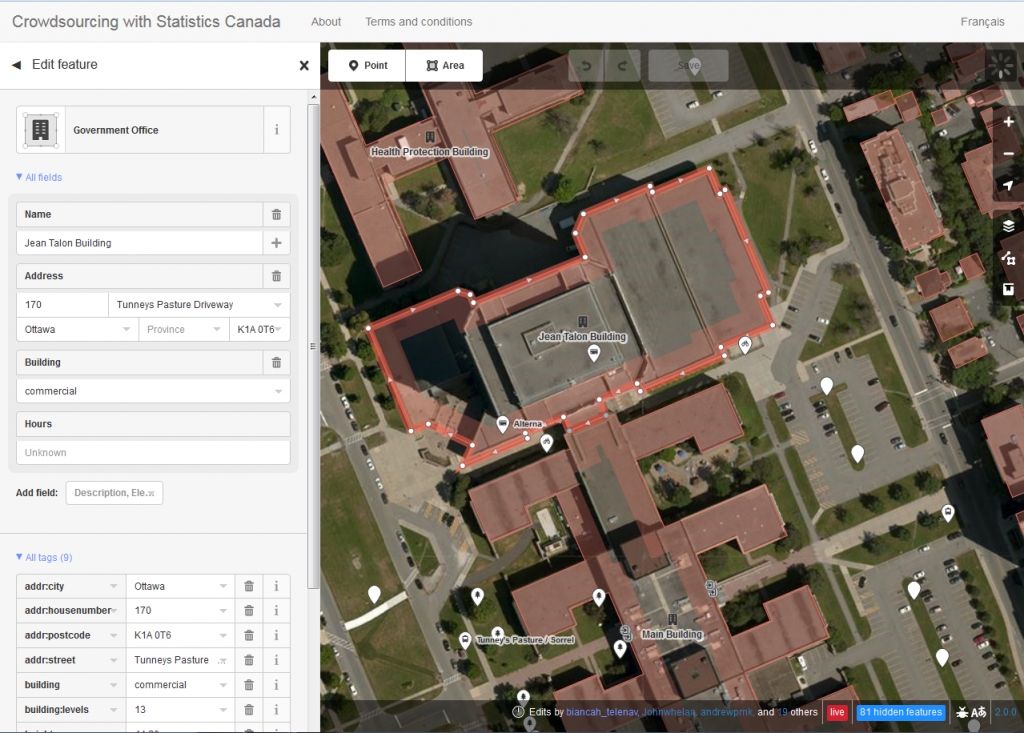
To crowdsource the data, the project uses OpenStreetMap, an open source platform that aims to map all features on the Earth’s surface through user-generated content. OSM allows anyone to contribute data and, under the Open Data Commons Open Database License (ODbL), anyone can freely use, disseminate and repurpose OSM data. In addition to the web page and campaign to encourage participation, Statistics Canada developed and deployed a customized version of OSM’s iD-Editor. This adapted tool allows participants to seamlessly add points of interest (POIs) and polygons on OSM. The platform includes instructions on how to sign up for OSM and how to edit, allowing anyone, whether tech-savvy or not, to contribute georeferenced data (Figure 1).

Figure 1. Snapshot of the customized version of OSM’s iD-Editor. Users can select a building or POI to see the attributes. Users can edit these attributes or they can create an entirely new point or area.

Statistics Canada has maintained communications with its stakeholders and participants through outreach, and has monitored contributions through dashboards. Outreach has taken place by communicating with the global and local OSM communities by using mailing lists and having local meetups, as well as by organizing webinars, presenting at local universities and participating in conferences associated with open data. Negotiation and collaboration with the City of Ottawa have also opened building footprints and addresses for contributors to add to the map.

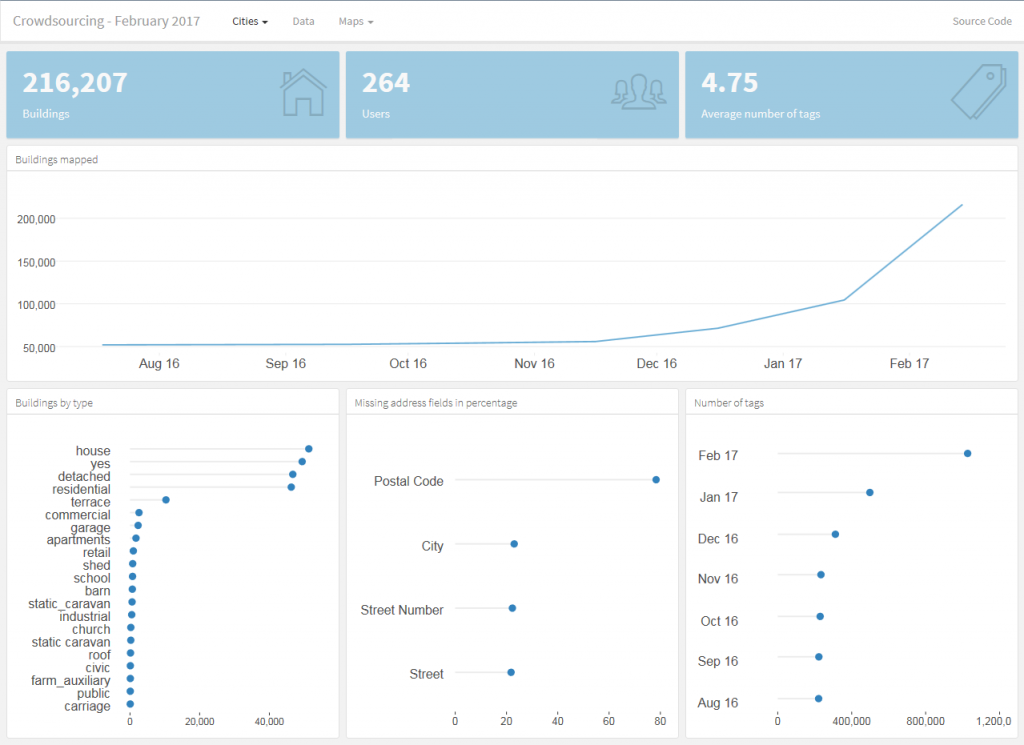
The project has been monitored using an open source dashboard developed by Statistics Canada. The dashboard provides a timeline (currently covering August 2016 to February 15, 2017) that specifies the number of buildings mapped, the number of users and the average number of tags contributed on OSM in each target city. Furthermore, it shows the amount of certain building types (e.g., house, residential, commercial) and the number of missing address fields by percentage (Figure 2). In general, the dashboard highlights the increased OSM contributions in Ottawa and Gatineau since the initiation of the project.

Figure 2. The open source dashboard monitors the production of data on OSM within the pilot project’s geographic scope of Ottawa and Gatineau. In the image above, both Ottawa and Gatineau have been selected. As seen in the top graph, buildings mapped in both cities have increased since the project’s initiation.

In the second year of the pilot project, Statistics Canada intends to develop a mobile app that will allow contributors to map on the go. Outreach will be maintained and, as more data are collected, quality assessments will be conducted. Success has been derived through collaborations, learning and sharing ideas, and developing user-friendly open source tools. As the project expands over time, Statistics Canada will uphold these values and approaches to ensure both an open and collaborative environment.

If you are interested in participating in the project, visit Statistics Canada’s Crowdsourcing website for a tutorial or to start mapping. Feel free to contact us at statcan.crowdsource.statcan@canada.ca to subscribe to a distribution list for periodic updates or to ask questions about the project.

Rural open data: more than just a technical issue

By Suthee Sangiambut

The conversation around open data is most commonly found at the city level. Ian Parfitt, GIS instructor and Coordinator of Selkirk College’s Selkirk Geospatial Research Centre, has a project looking at open data for rural communities. Parfitt’s past challenges in gaining access to data led to his project, which is helping to develop open data for planning in rural British Columbia. In an interview, Parfitt talked about issues of scale at both demand and supply sides for open data in the region stating that, “in the smaller communities, even digitisation is an issue. Some small communities still use paper maps.” Regarding the digital divide, internet connectivity in rural Canada lags behind larger urban centres, but it is unclear whether the pool of skills to draw upon is smaller than in cities says Parfitt. However, he noted that “if there is a divide in skills amongst users, that is likely to change.” The province of British Columbia is in the process of making programming an integral part of the school curriculum while initiatives such as CODE BC, supported by the provincial government, connect teachers with teaching material. Parfitt also notes that rural tech communities, such as in Nelson, BC are continuing to grow.

Some of the disparities between urban and rural data collection are due to population – larger population centres with more institutions and infrastructure simply produce more data. With economies of scale and an economic stimulus, it makes sense to have real-time data collection and analysis. Cities are also host to more consumers of data of all kinds. Parfitt says that it is “all about scale. Since federal institutions are interested in data they can roll out nationwide, and local governments focus on their own scales, rural areas tend to get left behind. At the same time, national and sub-national decision makers tend to be quite far away.”

Without the resources of federal government or a large municipality, rural areas face relatively high, and potentially unjustifiable costs when it comes to geospatial data collection and analysis. However, for Parfitt, rural data collection is more than just a cost issue. While he agreed that “centralization would help in certain cases”, particularly when it comes to the work on data standards of his own research group, Parfitt also emphasised that empowerment and autonomy are important to keep decision-making local. This ensures that “data serves some purpose and that those purposes are determined locally.” This, he admits, can be difficult when rural governments produce data in collaboration with other levels of government. The needs of rural communities can also be very different from urban communities such as risks of natural hazards, “we live in a mountainous area with big lakes. The transportation system is fragile. When only one road goes along the lake, a single fire or landslide could isolate the community.” For this reason, Parfitt’s research group is focusing on open data for planning around natural hazards.

Putting open data into the regional context, Dr. Jon Corbett (Geothink co-applicant, University of British Columbia Okanagan) says it is “completely different usership. Often, data has not been collected and archived because the needs for up-to-date information are not the same as in cities.” Therefore, rural data tends to be more static. However, Corbett continued, “this does not mean that legislators aren’t still subject to the same demands and requirements for participation, engagement, and informed decision-making.”

The effects of data release may also be different in rural areas says Corbett, “industry around land, such as resource extraction, use data often created and curated by government. If that data is made available, it would be good. On the other hand, look at issues around pipelines and dams. If we made that data available, it could even have adverse effects. Data for countermapping is a good idea, but sometimes that process can be appropriated by all kinds of groups, particularly those already in power.” Corbett highlighted that rural open data brings up even more issues of contention when put in context with First Nations, who need access to data to support land claims and review resource extraction proposals.

To address the above issues, Parfitt’s project is looking to collaborate with regional districts to make data available across communities. Key questions being asked are, “who is producing data, why, and how?” For more information on Ian Parfitt’s research group, visit the Selkirk Geospatial Research Centre website.

Dr. Corbett offered up some food for thought, “in the spirit of sharing government data, why don’t we expand our data repositories and include those outside government?”

Geothink co-applicant Dr. Teresa Scassa’s address to the Standing Committee on Transport, Infrastructure and Communities

Geothink co-applicant Dr. Teresa Scassa (University of Ottawa) recently appeared before the House of Commons’ Standing Committee on Transport, Infrastructure and Communities to speak on issues of data ownership and control, transparency, accountability and privacy in the context of smart cities. Speaking to the committee on 14 February, she emphasised the importance of “ensuring that the development of smart cities is consistent with the goals of open government.” She noted that data is viewed as a resource, therefore “where the collection or generation of data is paid by taxpayers it is surely a public resource.” In the smart city of the future, where data will be collected through sensors and citizen interactions with software platforms owned and operated by government or private firms, Scassa has voiced concern over rights of ownership and control over data. If data is collected on us as we navigate public spaces, do individuals maintain sovereignty over this data? Can cities maintain ownership over data collected by outsourced firms? Should the private sector owner of a sensor get to restrict access to data they collect, even in the context of open cities?

“How can we reconcile private sector and public sector data protection laws where the public sector increasingly relies upon the private sector for the collection and processing of its smart cities data?”

Scassa detailed three potential scenarios to explore these ideas. Read the full post on her blog here.

Geothinkers at the Spatial Knowledge and Information-Canada (SKI) conference in Banff

This year’s Spatial Knowledge and Information – Canada (SKI) conference will be held in Banff, AB on 24-25 February 2017. Several Geothink co-applicants and students will be presenting on their research, ranging from open data for public engagement and police-citizen interaction to the health and wellbeing of the homeless. Geothink Head, Dr. Renee Sieber, will also be making a keynote speech. Stay tuned for updates from the conference!

For the full programme, see here.

New Ryerson University Class from parternship between Dr. Pamela Robinson and Civic Tech Toronto

Ryerson University has an exciting new class in The Chang School of Continuining Education. Geothink co-applicant Dr. Pamela Robinson (Ryerson University School of Urban and Regional Planning) has partnered with Civic Tech Toronto to create CVUP 110: Digital Government and Civic Tech. This is a non-credit university course aimed specifically at teaching civil servants about digital-driven change in the public sector. The course covers prototyping, human-centred design, and agile project management.

The course will be held during the Spring/Summer 2017 term, from 8 March to 19 April.

To find out more about the course, you can attend a free information session to be held on 9 February, or see the course description here.

Augmented Reality in Real Life: Evaluating the Potential of New Digital Tools for Use in Municipal Planning Practice

By: Laura Brown, Natalia Dmuchowska, Brodie Johnson, Teresa Liu, Corinna Prior, Matthew Zentner

Pokémon Go was a phenomenon that swept the world this past summer. Cities around the globe experienced an influx of citizens into their public spaces as everyone tried to ‘catch-em-all.’ Crazed Pokémon trainers wandered the city swiping their phones and battling to win gyms, ultimately searching for the coveted Pikachu. The significance of these movements within the urban environment has been covered here.

The game is based on augmented reality (AR) technology that overlays a game world on top of a live map of the city, creating new ways for players to interact with the spaces around them. While other applications like Google Maps and Foursquare use similar technology, it was Pokémon GO that became the first game to achieve widespread success.

Over the last three months, a group of graduate researchers from the School of Urban and Regional Planning at Ryerson University also caught the PokéFever and sought to explore more serious aspects of the game. Working with clients from the City of Toronto Manager’s Office and Public Consultation Unit, their research investigates the challenges that municipalities face in working with new and emerging technologies and how urban planners might be able to use similar technology to consult and engage with the public. The potential of AR technology such as Pokémon GO to alter the behaviour of people in real space presents both opportunities to attract people to certain locations and animate space, as well as concerns regarding public safety and security, and inequities arising from disparities in access.

Pokémon GO Findings
Conducting an exploratory analysis into the relationship between game data and demographic data, the team first investigated the distribution of PokéStops and PokéGyms throughout Toronto. In the game, PokéStops are locations where players receive items necessary for gameplay, and players may join one of three teams and “battle” for possession of PokéGyms. For their research, however, the team was interested in these landmarks as fixed locations that draw players to visit them in the real world. In addition, the locations of these markers were selected based on the Google database as well as player suggestions from a previous AR game by the same developer called Ingress. According to the developer, the markers that were frequented most by Ingress players became Gyms in Pokémon GO, and the others became PokéStops.

While 90% of people within the city lived within a five-minute walk of game elements, access varies significantly in terms of density, disproportionately making the game play experience much richer in the downtown core. Whereas overcrowding in open spaces and parks became the focus of media attention, there was actually a much higher concentration of game elements along major corridors like Queen Street. Narrowing our boundaries to just the downtown core, however, did reveal higher concentrations of gyms and stops in open spaces. These results were surprising and suggest the different forms that the public realm takes across the city.

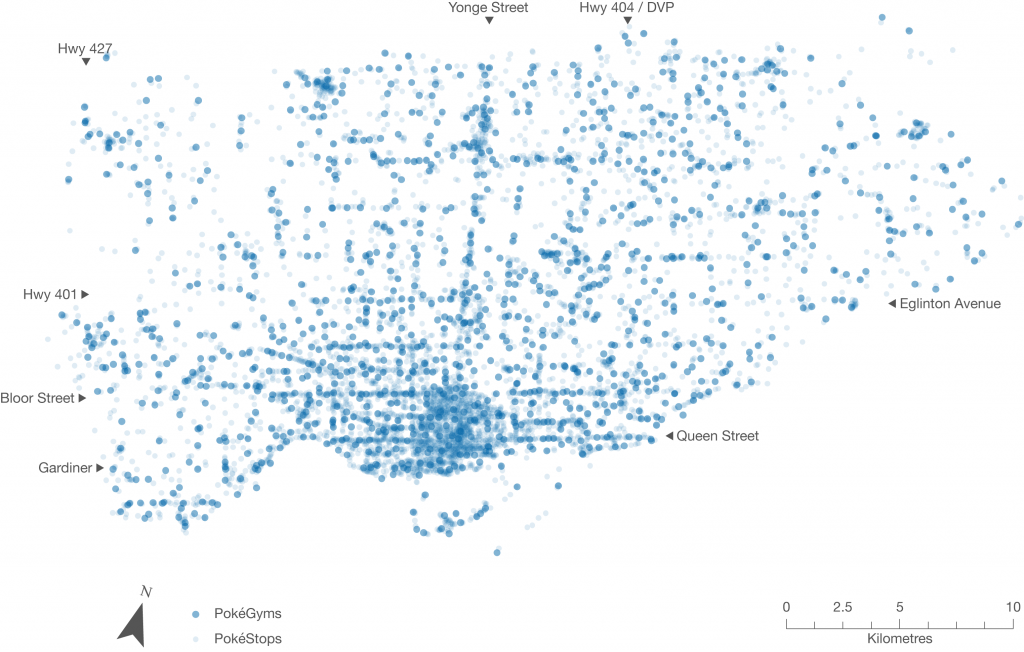
Figure 1. Indicators of concentrated play spaces in the City of Toronto, as represented by the fixed landmarks in Pokémon GO (PokéStops and Gyms)

Public Realm
As we moved through our analysis, something meaningful emerged. We started to think about Stops and Gyms as indicators of concentrated play spaces. The map below depicts what happens when you remove the road lines – clusters of dots begin to reflect desire paths into areas of the public realm that were appropriated for game play. Rather than simply revealing the distribution of the game throughout the urban fabric, the placement of the Stops and Gyms hint at the fine-grained spaces that interconnect more formal “Open Spaces” across the city. This may contribute to a more nuanced view of the public realm, in addition to the more obvious areas defined by parks and open spaces.

Figure 2. PokéStops and Gyms in the City of Toronto, without road lines

Because many of the Stop and Gym locations were user generated and determined on the basis of usage (based on Niantic’s previous AR game Ingress), they may serve as indicators of where players might want to linger and occupy the public realm, as well as landmarks that hold cultural significance. While we recognize that this data only reflects a segment of the public, we think it might be possible for city planners to use this data in their analyses of streetscapes and cultural heritage, to better visualize existing public assets. Further it provides insight into how citizens use spaces in the city.

Augmented Reality and Planning
Current public consultation and engagement practices with citizens and stakeholders are predicated on in-person interaction, although they are increasingly occurring through online and other platforms. AR technology can draw people to new spaces and change the way they move around the city. Harnessing AR could bring new opportunities for reaching different demographics in the places where they live, work, and play.

We looked at the potential of using augmented reality technology to enhance development proposal signs through geo-location and visualization. Imagine walking down a street and receiving a notification on your smartphone for a nearby development proposal. By clicking it on it, the user is guided to the location where they are shown a visualization of the project conveniently through their phone. This would provide more meaningful information about the size and scale of the project, allowing people to see the full extent of the proposal in human scale and in context, while reviewing specific details right then and there.

Figure 3. Application of AR technology for visualization of a development project. Source: Augment

Finally, augmented reality can be used as a platform for public education and collaboration between community groups to enhance heritage planning and the public realm. This could potentially transform the whole city into a new type of living museum without borders, inspiring people to feel greater ownership over the city and its heritage.

Evaluating Technology for Planning
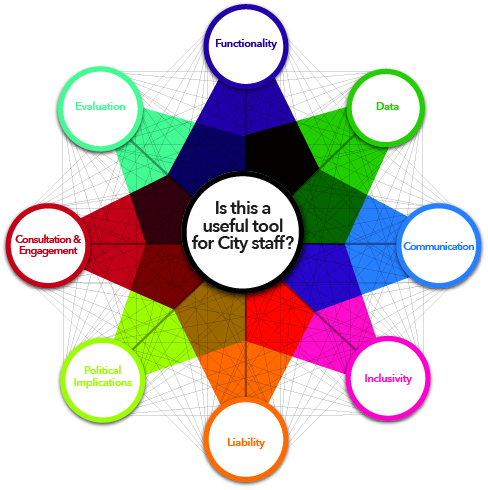
It is also necessary to understand how emerging technologies are created, implemented, and used. We have created an evaluative framework that explores the different areas planners must be aware of when evaluating new technology, an overview of which is shown in the figure below. These include the technical aspects and requirements (such as the platform of the technology), opportunities for greater engagement (ways to break down barriers like language and visual or auditory impairment), and potential inequalities and liabilities (such as data security concerns and differing abilities to access technology). Most importantly, this assessment allows planners to determine the usefulness of a technology in their daily planning practice.

Figure 4. Evaluative framework for planners for examining new technologies

The continually changing world of technology creates new opportunities that have the potential to enhance the way people interact with their city and the processes that govern it. We feel that planners are well placed to harness these emerging technologies to augment their cities in real life.

Although the Pokémon craze has since died down, it provided us with a unique opportunity to discover the potential of emerging technologies. We look forward to seeing what the future has in store for cities and for urban planners.

The full evaluative framework and results from the Pokémon GO analysis will be posted to the Geothink website shortly.

For more information please feel free to contact us at teampokeplan@gmail.com. Team PokéPlan is comprised of Laura Brown, Natalia Dmuchowska, Brodie Johnson, Teresa Liu, Corinna Prior and Matthew Zentner.

Thank you to our supervisor and Geothink co-applicant Dr. Pamela Robinson (Ryerson University, School of Urban and Regional Planning) and our clients at the City of Toronto!