Author Archives: Geothink

Spotlight on Recent Publications: Critical Reflections on Outcomes from Three Geoweb Partnerships

ACME_2015By Naomi Bloch

Exploring university–community partnerships

Participatory geospatial technologies have the potential to support and promote citizen engagement. This great promise has led to more collaborations between academics and community partners interested in pursuing this aim. In their recently published paper, “A web of expectations: Evolving relationships in community participatory geoweb projects,” four Geothink researchers and their colleagues cast a reflective eye on the participatory action research processes behind three completed geoweb partnership projects.

Co-author Jon Corbett, an associate professor in Community, Culture and Global Studies at the University of British Columbia’s Okanagan campus, sees their ACME journal article as helping to fill a gap in the geoweb literature.  “For me, one of the things I’m most interested in is how—in a truthful and well-positioned way—we can talk about the veracity of the work that we’ve done in regards to its ability to actually bring about impact and social change,” Corbett said.
In the article, the authors compare the different cases in order to consider some of the tangible, empirical challenges that the projects encountered, concentrating on the frictions that can occur where technical and social considerations intersect.

screenshot of local food map interface

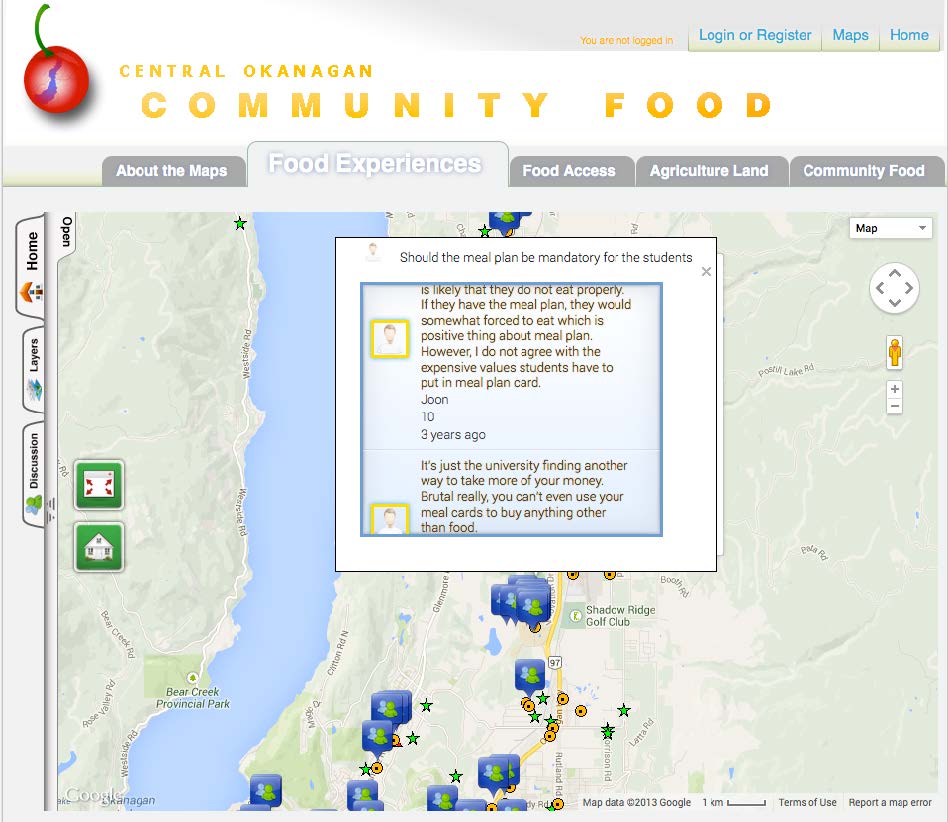
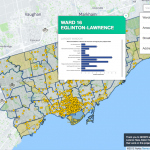
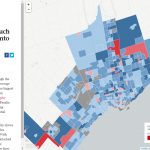
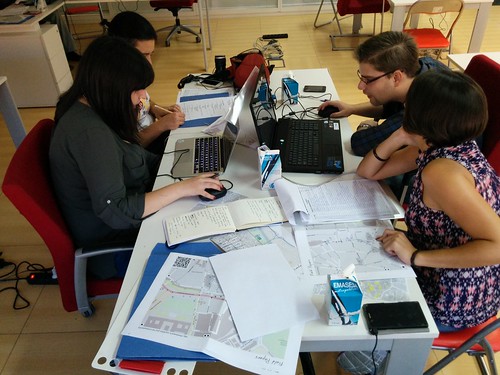
Central Okanagan Community Food Map interface

Participatory geoweb initiatives commonly rely on out-of-the-box mapping tools. For these three projects, a central aim was to employ the expertise of the university researchers to co-develop and co-evaluate custom geospatial web tools that could address community partners’ objectives. Ideally, such collaborations can benefit all parties. Researchers can learn about the potential and the limitations of the geoweb as a tool for civic engagement while partners have the opportunity to reflect on their objectives and access a wider tool set for accomplishing them. In reality, collaborations require compromises and negotiations. The question then becomes: when are researchers’ academic objectives and partners’ community objectives truly complementary?

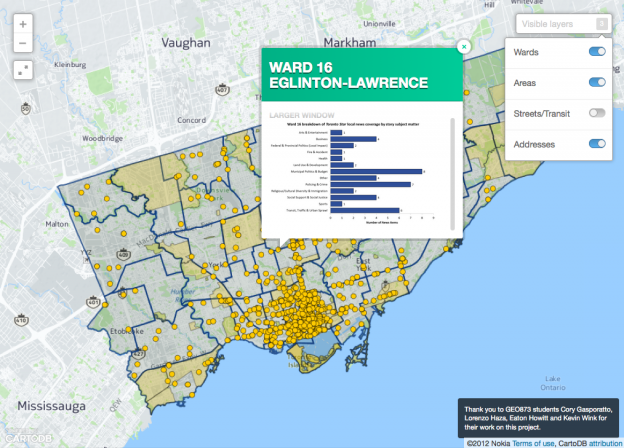
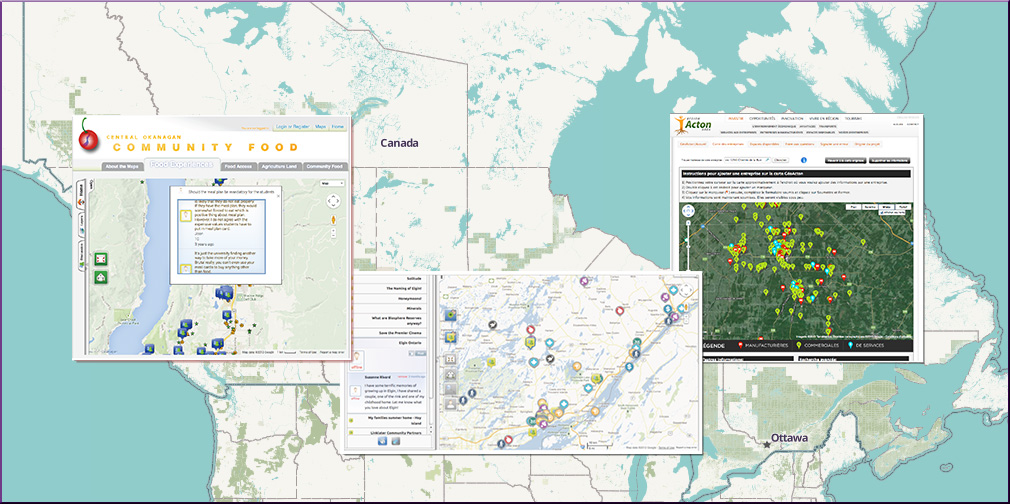
In the first case study, the geoweb was used to create a participatory business promotion website for a rural Quebec community, intended as one component of a larger regional economic development strategy. The second case was a collaboration between two university partners and a cultural heritage organization in Ontario. The partners hoped the customized online tool could “serve as a ‘living’ repository of cultural heritage information that was both accessible to the public and could facilitate the contribution of knowledge from the public.” In the third project, university researchers worked with government and grassroots organizations at local as well as provincial levels. The vision in this case was to enable non-expert community members in the Okanagan region to share their own knowledge and experiences about local food and its availability.

Corbett explained that in reflecting on their work, the researchers realized that as social scientists with very specific domains of expertise in political science, geographic information systems, and community research, “the types of skills we needed to negotiate the relationships were far different from the sorts of traditional disciplinary fields that we work in.”  Their collaborators tended to identify the academics more as technical consultants than scholars. As the authors write, “most academics remain untrained in software development, design, marketing, long-term application management and updating, legal related issues, [and] terms of service.”

Although the three collaborations were quite different in terms of the publics involved as well as the negotiated objectives of the projects and the tools employed to achieve them, the authors identified several key common themes. The authors note, “In all three case studies, we found that the process of technology development had substantial influence on the relationship between university developers and community organization partners. This influence was seen in the initial expectations of community partners, differential in power between researcher and community, sustainability of tools and collaborations, and the change from research collaboration towards ‘deal making.'”

In the end, Corbett said, “All of the projects were extremely precarious in how we could assign value or success to them. The paper was really an academic reflection on the outcomes of those three different projects.”

Abstract

New forms of participatory online geospatial technology have the potential to support citizen engagement in governance and community development. The mechanisms of this contribution have predominantly been cast in the literature as ‘citizens as sensors’, with individuals acting as a distributed network, feeding academics or government with data. To counter this dominant perspective, we describe our shared experiences with the development of three community-based Geospatial Web 2.0 (Geoweb) projects, where community organizations were engaged as partners, with the general aim to bring about social change in their communities through technology development and implementation. Developing Geoweb tools with community organizations was a process that saw significant evolution of project expectations and relationships. As Geoweb tool development encountered the realities of technological development and implementation in a community context, this served to reduce organizational enthusiasm and support for projects as a whole. We question the power dynamics at play between university researchers and organizations, including project financing, both during development and in the long term. How researchers managed, or perpetuated, many of the popular myths of the Geoweb, namely that it is inexpensive and easy to use (thought not to build, perhaps) impacted the success of each project and the sustainability of relationships between researcher and organization. Ultimately, this research shows the continuing gap between the promise of online geospatial technology, and the realities of its implementation at the community level.

Reference: Johnson, Peter A, Jon Corbett, Christopher Gore, Pamela J Robinson, Patrick Allen, and Renee E Sieber. A web of expectations: Evolving relationships in community participatory geoweb projects. ACME: An International E-Journal for Critical Geographies, 2015, 14(3), 827-848.

If you have thoughts or questions about this article, get in touch with Naomi Bloch, Geothink’s digital journalist, at naomi.bloch2@gmail.com.

Journalism: Storytelling in the Geodata Age

By Naomi Bloch

The rise of more accessible geospatial web tools along with expanding sources of open data have fostered a potent—if somewhat techno-utopian—civic vision. For those immersed in understanding this new digital landscape, one question often surfaces: who’s truly putting these resources to use?

The most reliable answer is perhaps an obvious one. “Journalists are making huge use of mapping and geodata for storytelling, for the visualization of stories, and for investigative reporting purposes,” said April Lindgren, an associate professor at Ryerson University’s School of Journalism and founding director of the Ryerson Journalism Research Centre, a Geothink partner organization.

As a scholar, Lindgren’s own research employs data mapping techniques to examine the geography of news coverage and the role of Canadian media in society. “Maps have actually been quite a powerful tool for us to explore patterns of local news and understand how it works. It opened up a whole new way of getting at and understanding the data because we were able to visualize it.

“Before that, it was the old problem of columns and reams of numbers” Lindgren said. “But being able to map it allowed us to show geographically, yes, most of the news coverage is focused on downtown Toronto. So why is that? And what are the implications of not doing much coverage in other areas of the city? And furthermore, we mapped the types of topics. So what does it mean when most of the news that they publish about certain areas is crime coverage? What does that do in terms of the geographic stereotyping?”

Computer-assisted reporting revisited

Lindgren notes that the use of mapping and data analysis for actual journalistic purposes is not a new phenomenon. Over twenty years ago, in 1993, Miami Herald research editor Steve Doig won a Pulitzer Prize for his investigative coverage of Hurricane Andrew’s aftermath in Florida. The year prior, Doig and his colleagues spent several intensive months processing and evaluating two data sets—one that helped to map out property damage caused by the hurricane and another documenting wind speeds at different locations and times throughout the storm. “They noticed from using mapping that the damage was much more extensive in certain areas than in others, and then they started trying to figure out why that was, because weather-wise it was the same storm,” Lindgren explained.

What Went Wrong > Miami Herald, December 20, 1992 > Page 1

“What Went Wrong > Miami Herald, December 20, 1992 > Page 1” (originally published Dec. 20, 1992). Flickr photo by Daniel X. O’Neil, licensed under CC BY 2.0

Further investigation unveiled that several different developers had been responsible for real estate construction in different regions. “And it led them to a conclusion and a very powerful piece of journalism showing that it had to do with the building standards of the different developers,” said Lindgren. “So that was one of the early uses of mapping and data journalism, showing what a useful tool it could be.”

As researchers raise questions about the skills and motivations that enable citizen engagement with open data and geospatial technologies, journalism schools are increasingly recognizing the need to integrate a formal understanding of data journalism into the curriculum.

At the 2014 Geothink Annual General Meeting, Lindgren met a fellow researcher with complementary interests—Marcy Burchfield, executive director of the Toronto-based Neptis Foundation. The aim of Neptis has been to apply the unique capabilities of mapping and spatial analysis to help decision makers and the public understand regional issues in the Greater Toronto Area. The Geothink encounter led to the development of a Neptis-led geodata workshop for senior-level students enrolled in Ryerson’s journalism school, exposing students to some statistics basics as well as the various challenges of working with spatial data to develop meaningful stories.

“Getting the data into a usable form, I think, is probably the biggest challenge technically for journalists,” said Lindgren. “Although the skills are rapidly increasing and we’re training our students to do that.”

At Ryerson, undergraduates are required to take an introductory digital journalism course that critically engages with social media and citizen journalism along with new forms of multimedia and alternative storytelling methods. A separate “visualizing facts” elective course aims to provide hands-on experience with various data visualization techniques including mapping, while reinforcing numeracy skills (something that, historically, journalists have not been known for).

Data’s fit for purpose?

CBC News Pledge to Vote Map

CBC News’s crowdsourced, interactive “Pledge to Vote” map, part of their 2015 Canada Votes coverage.

In recent years Canadian data journalists have garnered international attention both for their creative uses of geodata and their involvement in the push for open access to government information. “One of the big problems is the availability of data,” Lindgren said. “What’s available? How good is it? How hard do you have to fight for it? Is it really available through an open data source or do you have to go through Freedom of Information to get it?”

While increasingly media outlets are exploring the possibilities of engaging the public to create crowdsourced content by volunteering their geodata, the data sets that journalists tend to be interested in—ideally, data that can support rich, informative stories relevant to public interest—are not typically collected with the journalist in mind. In particular, government data sources have often been generated to support internal administrative needs, not to address transparency and accountability concerns per se. Data input decisions may not be documented, and agencies may “silently” post-process the information before distributing it to journalists or the greater public. This makes the process of learning how to clean up inconsistent, non-standardized data developed for a very different audience a particularly important skill for journalists to acquire. Only then can a journalist build an understanding of the data’s patterns and the stories they can support.

“You’re only as good as your data,” Lindgren emphasized. “In some ways the act of journalism allows you to test the data and see how good it is. Because the data may be telling you one thing, but then when you go out on the ground and you start interviewing and looking around you may find that what you’re seeing and hearing doesn’t seem to match what the data is telling you.

“So right away, as a journalist you’re going to be suspicious of that. And there are two places where this could be wrong. Either you’re talking to the wrong people or you’re not talking to a broad enough range of people—or there might be something wrong with the data.”

Verifying data accuracy is a time-honoured tradition

Lindgren shared the example of a colleague who was investigating the issue of slum landlords. The reporter asked the municipality to provide data on property standards complaints. Upon receiving and eventually mapping the data, the reporter and his colleagues made a surprising discovery. “They noticed that there was a section of the city that didn’t have any complaints. They thought that was odd, because they knew that there were a lot of rental areas and low-income areas there, with people living in somewhat vulnerable housing situations.”

Ultimately, the dissonance between the story on the ground and the story in the data led the reporter to go back to the city seeking further verification, and the nature of the problem soon revealed itself. It seems that a summer student had been in charge of aggregating and disseminating the data to the journalists when the information was requested, and that student had overlooked one section of the city.

While this particular story reflects human error during the communication phase rather than the data collection phase, Lindgren points out that the strong journalistic traditions of seeking verification and being suspicious of information sources puts the media in a unique position to evaluate data’s quality. “Verification is a fundamental element of journalism. That’s what we do that’s different from anybody who is just commenting out there online. The main issue is: is it verifiable, and what’s the public interest? That’s the starting point.”

Where public and private interests intersect

What constitutes “public interest” is a conversation that still needs to happen. The push for open data and the fact that personal information is increasingly accessible online has led parties both within and beyond government to raise concerns about how to strike the balance between privacy and transparency—and what the right balance may be.  Data sets often contain personal or identifying information. Cleansing the data of that information is not straightforward. Even when data appear on the surface anonymized, there are ever increasing opportunities to combine and process seemingly unrelated data sets in ways that can identify individuals and compromise personal information. As Geothink co-applicant researcher Teresa Scassa has addressed more than once in her work, this is not a theoretical problem but a reality that is already occurring.

Lindgren, however, said she does not see data journalism as giving rise to new types of ethical concerns for the media. “Obviously, a balance has to be struck. But the reality is that oftentimes the data is very generalized. It really depends on what the issue is and what the information is.

“The whole privacy issue is really a red flag, a lot of times, for journalists, because it can be used by governments as a pretext for not releasing information that governments just don’t want the public to know. The two reasons they don’t release information is privacy and violating commercial interests, and then the third reason is political consideration, but they can’t couch it in those terms.”

In terms of how journalists themselves strike that balance, Lindgren said this must be assessed on a case by case basis. “Basically, our job is invading people’s space, quite often. So we have to—and we do—make those judgment calls every day. The data is just another layer of that, or another area where we’d have to think about it and have those discussions.

“What it comes down to is you’re weighing, what’s the public interest in this information? There’s no hard and fast rule. It depends on what the information is.”

If you have any questions for April, reach her on Twitter here: @aprilatryerson

If you have thoughts or questions about this article, get in touch with Naomi Bloch, Geothink’s digital journalist, at naomi.bloch2@gmail.com.

Crosspost: Being Philosophical About Crowdsourced Geographic Information

This Geo: Geography and Environment blog post is cross-posted with permission from the authors, Renée Sieber (McGill University, Canada) and Muki Haklay (University College London, UK).
By Renée Sieber and Muki Haklay

Our recent paper, The epistemology(s) of volunteered geographic information: a critique, started from a discussion we had about changes within the geographic information science (GIScience) research communities over the past two decades. We’ve both been working in the area of participatory geographic information systems (GIS) and critical studies of geographic information science (GIScience) since the late 1990s, where we engaged with people from all walks of life with the information that is available in GIS. Many times we’d work together with people to create new geographic information and maps. Our goal was to help reflect their point of view of the world and their knowledge about local conditions, not always aim for universal rules and principles. For example, the image below is from a discussion with the community in Hackney Wick, London, where individuals collaborated to ensure the information to be captured represented their views on the area and its future, in light of the Olympic works that happened on their doorstep. The GIScience research community, by contrast, emphasizes quantitative modelling and universal rules about geographic information (exemplified by frequent mentioning of Tobler’s first law of Geography). The GIScience research community was not especially welcoming of qualitative, participatory mapping efforts, leaving these efforts mostly in the margins of the discipline.

Photo of 2007 participatory mapping contributors working together in Hackney Wick, London, 2007

Participatory Mapping in Hackney Wick, London, 2007

Around 2005, researchers in GIScience started to notice that when people used their Global Positioning System (GPS) devices to record where they took pictures or used online mapping apps to make their own maps, they were generating a new kind of geographic information. Once projects like OpenStreetMap and other user-generated geographic information came to the scene, the early hostility evaporated and volunteered geographic information (VGI) or crowdsourced geographic information was embraced as a valid, valuable and useful source of information for GIScience research. More importantly, VGI became an acceptable research subject, with subjects like how to assess quality and what motivates people to contribute.

This about-face was puzzling and we felt that it justified an investigation of the concepts and ideas that allowed that to happen. Why did VGI become part of the “truth” in GIScience? In philosophical language, the questions ‘where does knowledge come from? how was it created? What is the meaning and truth of knowledge?’ is known as epistemology and our paper evolved into an exploration of the epistemology, or more accurately the multiple epistemologies, which are inherent in VGI. It’s easy to make the case that VGI is a new way of knowing the world, with (1) its potential to disrupt existing practices (e.g. the way OpenStreetMap provide alternative to official maps as shown in the image below) and (2) the way VGI both constrains contributions (e.g., 140 chars) and opens contributions (e.g., with its ease of user interface; with its multimedia offerings). VGI affords a new epistemology, a new way of knowing geography, of knowing place. Rather than observing a way of knowing, we were interested in what researchers thought was the epistemology of VGI. They were building it in real-time and attempting to ensure it conformed to existing ways of knowing. An analog would be: instead of knowing a religion from the inside, you construct your conception of it, with your own assumptions and biases, while you are on the outside. We argue that construction was occurring with VGI.

OpenStreetMap mapping party (Nono Fotos)

OpenStreetMap mapping party (Nono Fotos)

We likewise were interested in the way that long-standing critics of mapping technologies would respond to new sources of data and new platforms for that data. Criticism tends to be grounded in the structuralist works of Michel Foucault on power and how it is influenced by wider societal structures. Critics extended traditional notions of volunteerism and empowerment to VGI, without necessarily examining whether or not these were applicable to the new ‘ecosystem’ of geospatial apps companies, code and data. We also were curious why the critiques focussed on the software platforms used to generate the data (e.g., Twitter) instead of the data themselves (tweets). It was as if the platforms used to create and share VGI are embedded in various socio-political and economic configurations. However, the data were innocent of association with the assemblages. Lastly, we saw an unconscious shift in the Critical GIS/GIScience field from the collective to the personal. Historically, in the wider field of human geography, when we thought of civil society mapping together by using technology, we looked at collective activities like counter-mapping (e.g., a community fights an extension to airport runway by conducting a spatial analysis to demonstrate the adverse impacts of noise or pollution to the surrounding geography). We believe the shift occurred because Critical GIS scholars were never comfortable with community and consensus-based action in the first place. In hindsight, it probably is easier to critique the (individual) emancipatory potential as opposed to the (collective) empowerment potential of the technology. Moreover, Critical GIS researchers have shifted their attention away from geographic information systems towards the software stack of geospatial software and geosocial media, which raises question about what is considered under this term. For all of these reasons and more we decided to investigate the “world building” from both the instrumentalist scientists and from their critics.

We do use some philosophical framing—Borgmann has a great idea called the device paradigm—to analyse what is happening, and we hope that the paper will contribute to the debate in the critical studies of geographical information beyond the confines of GIScience to human geography more broadly.

About the authors: Renée E. Sieber is an Associate Professor in the Department of Geography and the School of Environment at McGill University. Muki Haklay is Professor of Geographical Information Science in the Department of Civil, Environmental and Geomatic Engineering at University College London.

Geothink Student Twitter Chat on Location and Privacy on the Geoweb

Laura Garcia, PhD student at the University of Ottawa under Prof. Elizabeth Judge (University of Ottawa), recently conducted a Spanish language Twitter chat with students at Los Andes University.

Discussion revolved around privacy issues especially in location-based services on the Geoweb 2.0. Using the hashtag #locationmine, participants discussed how location is both ‘mine’ in the sense of being very personal and private information and a mine of data to be exploited. Protecting privacy requires education, laws, regulation, and maybe even changes to technologies (such as the creation of standards). We are in the midst of changes in the technological landscape that are already having an effect on the amount of privacy internet users can realistically have, and this will continue into the future. Not only is technology changing, our habits are also changing as well, resulting in many agreeing to terms of use without a proper examination or thought over the details. Locational privacy must be debated and defined as a response to changes in the ecosystem, to enable proper regulation and protection of rights.

Laura presented the discussants with five conclusions:

  1. One of the most important elements of the right to privacy is for the user to have control over the information shared and who has access this information
  2. It is not easy to find and/or remove the collection of geographic information made automatically by some technologies and companies. Therefore, in these cases the user does not have control over the collection of their locational information
  3. It is important for the users of the Geoweb to take an active role in the protection of their privacy
  4. Better regulations are needed. These need to be mandatory and unambiguous
  5. Civil society needs to advocate for its own rights and demand corporate social responsibility

View the chat transcript below.

Geothoughts 7: Unpacking the Current and Future Value of Open Civic Data

Geothink researcher Peter Johnson and his students have been working with government partners across the country to examine the state of civic open data projects in Canada.

Geothink researcher Peter Johnson and his students have been working with government partners across the country to examine the state of civic open data projects in Canada.

By Naomi Bloch

Peter Johnson image

Peter Johnson, assistant professor in the University of Waterloo Department of Geography and Environmental Management, was recently awared Ontario’s Young Researcher Award.

Geothink co-applicant researcher Peter A. Johnson is an assistant professor of Geography and Environmental Management at the University of Waterloo. Johnson and his students have been working with Geothink government partners across the country to examine the state of civic open data projects in Canada. In our latest podcast, he discusses how the seemingly desirable ethos of open data may nonetheless hamper our understanding of how end users are interacting with government products.

In their July article published in Government Information Quarterly, Johnson and Geothink head Renee Sieber discuss what they see as the dominant models—and related challenges—of civic open data today. The authors suggest that these models may carry potentially conflicting motivations. Governments can distribute data and leave it to users to discover and determine data’s value, they may aim to track civic issues in ways that are cost efficient, or they may also try to support market innovation via data provision and the promotion of crowd-sourced contributions. On the other hand, open data efforts also have the potential to enable productive and empowering two-way civic interactions when motivated by non-economic imperatives.

What future directions will government data provision take? That may depend a lot on the choices that government agencies—and end users—make today.


If you have thoughts or questions about this podcast, get in touch with Naomi Bloch, Geothink’s digital journalist, at naomi.bloch2@gmail.com.

Reference
Sieber, R. E., & Johnson, P. A. (2015). Civic open data at a crossroads: Dominant models and current challenges, Government Information Quarterly, 32(3), pp. 308-315. doi:10.1016/j.giq.2015.05.003. OR: View pre-print copy.

Abstract
As open data becomes more widely provided by government, it is important to ask questions about the future possibilities and forms that government open data may take. We present four models of open data as they relate to changing relations between citizens and government. These models include; a status quo ‘data over the wall’ form of government data publishing, a form of ‘code exchange’, with government acting as an open data activist, open data as a civic issue tracker, and participatory open data. These models represent multiple end points that can be currently viewed from the unfolding landscape of government open data. We position open data at a crossroads, with significant concerns of the conflicting motivations driving open data, the shifting role of government as a service provider, and the fragile nature of open data within the government space. We emphasize that the future of open data will be driven by the negotiation of the ethical-economic tension that exists between provisioning governments, citizens, and private sector data users.

Geothoughts 6: Who Stands to Gain in Canada’s Sharing Economy?

This July, Alberta residents were warned that drivers who use Uber’s car-sharing service may not have appropriate insurance coverage, with potential risks to both drivers and passengers.

This July, Alberta residents were warned that drivers who use Uber’s car-sharing service may not have appropriate insurance coverage, with potential risks to both drivers and passengers.

By Naomi Bloch

The rise of the web-enabled sharing economy is leading to much hope about potentially new sources of income and new ways for communities to connect and share resources. In the process, however, more consumers appear to be turning to global tech companies to acquire convenient, local services.

This July, Alberta residents were warned that drivers who use Uber’s car-sharing service may not have appropriate insurance coverage, with potential risks to both drivers and passengers. Earlier this month in Ontario’s Kitchener-Waterloo region, the local cab company Waterloo Taxi released its new mobile app. The company hopes the app will help it to maintain its edge against Uber, a recent—and not entirely legal—entry to the local marketplace. Meanwhile, starting this fall, Quebec will begin regulating the online home rental service Airbnb.

In this podcast, we interview Geothink co-applicant Leslie Regan Shade, associate professor in the University of Toronto’s Faculty of Information. Together with PhD candidate Harrison Smith, Shade has been exploring the “cartographies of sharing,” situating the geoweb in the sharing economy of Canada. Shade is particularly interested in the political economic questions now surfacing in the media, in policy circles, and in academia. She and Smith are focusing on three inter-related questions:

  1. What is the state of the sharing economy in Canada, particularly with respect to the fundamental opportunities and challenges currently facing municipal regulators in Canada?
  2. What particular benefits and challenges has the sharing economy brought to Canadian economies, particularly key urban centres?
  3. How is the geoweb contributing to the rise of the sharing economy in Canada?


If you have thoughts or questions about this podcast, get in touch with Naomi Bloch, Geothink’s digital journalist, at naomi.bloch2@gmail.com.

Local News Research Project map of Toronto news coverage

Crosspost: How is your Toronto neighbourhood portrayed in the news? Check it out using these interactive maps

This post is cross-posted with permission from April Lindgren and Christina Wong at Local News Research Project. 

By April Lindgren and Christina Wong

Introduction
Concerns about how neighbourhoods are portrayed in the news have surfaced regularly in the Toronto area over the years. But are those concerns valid?

Interactive maps produced by the The Local News Research Project (LNRP) at Ryerson University’s School of Journalism are designed to help Toronto residents answer this question. The maps give the public access to data the research project collected on local news coverage by the Toronto Star and the online news website OpenFile.ca. The maps can be used by members of the public and researchers to:

  • get an overall sense of where news in the city is – and isn’t – covered
  • compare patterns of local news coverage by two different news organizations
  • examine the city-wide geographic patterns of reporting on crime, entertainment and other major news topics
  • examine news coverage in each of Toronto’s 44 wards including how often the news stories and photographs reference locations in a ward
  • see what story topics are covered in each ward

The maps are based on the Toronto Star’s local news coverage published on 21 days between January and August, 2011. Researchers have found that a two-week sample of news is generally representative of news coverage over the course of a year (Riffe, Aust & Lacy, 1993). The data for OpenFile.ca, which suspended publishing in 2012, were collected for every day in 2011 between January and August.

Click here to see the maps or continue reading to find out more about news coverage and neighbourhood stereotyping, how the maps work, and the role of open data sources in this project.


Local news and neighbourhood stereotyping
The decision to explore news coverage of Toronto neighbourhoods was prompted by concerns expressed by citizens and local politicians about how certain parts of the city are portrayed in the local media. Residents were furious (Pellettier, Brawley & Yuen, 2013), for instance, when Toronto Star columnist Rosie Dimanno referred to the city’s Scarborough area as “Scarberia” in an article about former mayor Rob Ford’s re-election campaign (DiManno, 2013). Back in 2007, then-mayor David Miller went so far as to contact all of the city’s news media asking them to cite the nearest main intersection rather than reporting more generally that a particular crime occurred in Scarborough (Maloney, 2007). In Toronto’s west end, the local city councillor suggested negative connotations associated with the Jane and Finch neighbourhood could be diffused by renaming it University Heights, but the idea was vehemently rejected by residents (Aveling, 2009).

A study that investigated how Toronto’s most disadvantaged neighbourhoods were covered by the Toronto Star concluded that there was very little coverage of news in these communities (Lindgren, 2009). The study, which examined Toronto Star local news reporting in 2008, also found that crime tended to dominate the limited coverage that did take place and suggested the problem could be rectified not by ignoring crime stories, but by increasing coverage of other sorts of issues in those communities.


Exploring the maps
The interactive maps allow users to explore local news coverage in the City of Toronto. A sample of local stories and photographs from the Toronto Star (the local newspaper with the largest circulation in the city) and OpenFile.ca (a community-based news website) were identified and analyzed in 2011 to capture data about story topics and mentions of geographic locations.

These maps make the data available to the public in a way that allows users to explore and compare media coverage in different areas of the city. Users can zoom in on a neighbourhood and discover all of the locations referenced within a neighbourhood. Each point on the map represents a location that was referenced in one or more news items. Users can click on any of these points to see a list of news articles associated with each location (Figure 1).

Figure 1. Users can click each point to find out about the news articles that referenced the location

By clicking within a ward boundary, users can also access a summary chart describing the breakdown by subject of all local news coverage in that ward. Users interested in the Scarborough area, for instance, can zoom into that area on the map and click on each Scarborough ward to see what sorts of stories (crime, transit, entertainment, sports, etc.) were reported on in that ward (Figure 2).

Figure 2. Users can click within a ward to access charts summarizing news coverage by topic

Users interested in how and where a particular news topic is covered can access separate interactive maps for the top five subjects covered by the two news sources. Figure 3, for example, shows all locations mentioned in crime and policing stories published by the Toronto Star during the study’s sample period.

Figure 3. Toronto Star coverage of crime and policing news

The role of open data sources in creating these maps
A total of 23 pre-existing datasets were used to support the creation of these interactive maps including relevant open datasets that were publically available online in 2008. The datasets were used to populate a list of geographic locations in the GTA that had the potential to be referenced in local news stories. Each dataset was assigned unique numerical codes and all 23 datasets were appended to a geographic reference table that coders could search. The incorporated reference list of geographic locations and features allowed for a more accurate and efficient coding process: Coders entering information about spatial references in local news items were able to select many of the referenced geographic locations from the pre-populated list rather than entering the information manually. This improved accuracy because it helped prevent human error and also sped up the coding process.

We would have preferred to use more open data sources during the initial development of the database, but this wasn’t possible due to limited availability of datasets with the spatial attributes that make mapping possible. At that time, only two of the 23 datasets used (approximately 8.7% of the total) were available from open data sources in a format that included geography (such as shapefiles). Both files were obtained from the City of Toronto’s Open Data website. These limitations meant that the majority of the database relied on contributions from private data sources.

The situation has improved over time as more open government data become available in geographic file formats that support research with spatial analysis. As of mid-2015, six more of the 23 datasets (two federal, one provincial and three municipal) used in the database have become available. If we were creating the database today, a total of eight datasets or 34.8% of the initial database could be populated using open data sources (Table 1).

Table 1. Availability of open data sources
Available in 2008 when the database was created Currently available
Private sources 21 15
Government open data 2   (8.7% of database) 8 (34.8% of database)
Total # of datasets 23 23


Since 2008, the Government of Canada has launched its own open data portal, joined the Open Government Partnership alongside other countries supporting the release of open government data, and adopted the G8 Open Data Charter (Standing Committee on Government Operations and Estimates, 2014). Provincial and municipal governments have made similar improvements to open data access. The Government of Ontario launched an online open data catalogue in 2012 and is currently developing an Open Data Directive to be implemented later this year (Fraser, 2015). The City of Toronto introduced its open data portal in 2009 and developed an Open Data Policy in 2012 (City of Toronto, n.d.).

As Table 1 suggests, however, further improvements are required to reduce barriers to research and innovation. A report from the Standing Committee on Government Operations and Estimates, for instance, recommended that the federal government provide data at smaller levels of geography, work together with different levels of government to establish standards and release data, and provide a greater variety of open data to reflect all government departments. The report noted that the release of open data can improve government efficiency, foster citizen engagement, and encourage innovation (Standing Committee on Government Operations and Estimates, 2014). Academic researchers have argued that improvements in the availability of open government data would stimulate valuable research and outcomes with economic and social value (Jetzek, Avital & Bjorn-Andersen, 2014; Kucera, 2015; Zuiderwijk, Janssen & Davis, 2014). Journalists are also pushing for easier and greater access to data (Schoenhoff & Tribe, 2014).


Conclusion
Research conducted by the Local News Research Project was made possible by public funds and as such the data should be widely available. The interactive maps are an attempt to fulfill that obligation.

While the maps capture only a snapshot of news coverage at a fixed point in time, they nonetheless demonstrate the importance of geospatial analysis in local news research (Lindgren & Wong, 2012). They are also a powerful data visualization tool that allows members of the public to independently explore media portrayals of neighbourhoods and the extent to which some parts of a city are represented in the news while others are largely ignored.

Finally, this mapping project also illustrates how open government data can foster research and how much there is still to do in terms of making data available to the public in useful formats.


The Local News Research Project was established in 2007 to explore the role of local news in communities. Funding for this research has been provided by Ryerson University, CERIS-The Ontario Metropolis Centre and the Social Sciences and Humanities Research Council.

About the authors: Lindgren is an Associate Professor in Ryerson University’s School of Journalism and Academic Director of the Ryerson Journalism Research Centre. Christina Wong is a graduate of Ryerson University’s Geographic Analysis program. Initial work on the maps was done in 2014 by GEO873 students Cory Gasporatto, Lorenzo Haza, Eaton Howitt and Kevin Wink from Ryerson University’s Geographic Analysis program.


References

Avaling, N. (2009, January 8). Area now being called University Heights, but some call change a rejection of how far we’ve come. Toronto Star, p. A10.

City of Toronto. (n.d.). Open Data Policy. Retrieved from http://www1.toronto.ca/wps/portal/contentonly?vgnextoid=7e27e03bb8d1e310VgnVCM10000071d60f89RCRD

DiManno, R. (2013, July 6). Ford fest makes a strategic move. Toronto Star, p. A2.

Jetzek, T., Avital, M. & Bjorn-Andersen, N. (2014). Data-driven innovation through open government data. Journal of Theoretical and Applied Electronic Commerce Research, 9(2), 100-120.

Fraser, D. (2015, May 1). Ontario announces more open data, public input. St. Catharines Standard. Retrieved from http://www.stcatharinesstandard.ca/2015/05/01/ontario-announces-more-open-data-public-input

Kucera, J. (2015). Open government data publication methodology. Journal of Systems Integration, 6(2), 52-61.

Lindgren, A. (2009). News, geography and disadvantage: Mapping newspaper coverage of high-needs neighbourhoods in Toronto, Canada. Canadian Journal of Urban Research, 18(1), 74-97.

Lindgren, A. & Wong, C. (2012). Want to understand local news? Make a map. 2012 Journalism Interest Group proceedings. Paper presented at Congress 2012 of the Humanities and Social Sciences conference. Retrieved from http://cca.kingsjournalism.com/?p=169

Maloney, P. (2007, January 16). Mayor sticks up for Scarborough. Toronto Star. Retrieved from http://www.thestar.com/news/2007/01/16/mayor_sticks_up_for_scarborough.html?referrer=

Pellettier, A., Brawley, D. & Yuen, S. (2013, July 11). Don’t call us Scarberia [Letter to the editor]. Toronto Star. Retrieved from http://www.thestar.com/opinion/letters_to_the_editors/2013/07/11/dont_call_us_scarberia.html

Riffe, D., Aust, C. F. & Lacy, S. R. (1993). The effectiveness of random, consecutive day and constructed week sampling. Journalism Quarterly, 70, 133-139.

Schoenhoff, S. & Tribe, L. (2014). Canada continues to struggle in Newspapers Canada’s annual FOI audit [web log post]. Retrieved from https://cjfe.org/blog/canada-continues-struggle-newspapers-canada%E2%80%99s-annual-foi-audit

Standing Committee on Government Operations and Estimates. (2014). Open data: The way of the future: Report of the Standing Committee on Government Operations and Estimates. Retrieved from http://www.parl.gc.ca/content/hoc/Committee/412/OGGO/Reports/RP6670517/oggorp05/oggorp05-e.pdf

Zuiderwijk, A., Janssen, M. & Davis, C. (2014). Innovation with open data: Essential elements of open data ecosystems. Information Polity, 19(1, 2), 17-33.