Mapping Inclusive Employment: Community Engagement on the Participatory Geoweb

Project partners exploring the interactive map

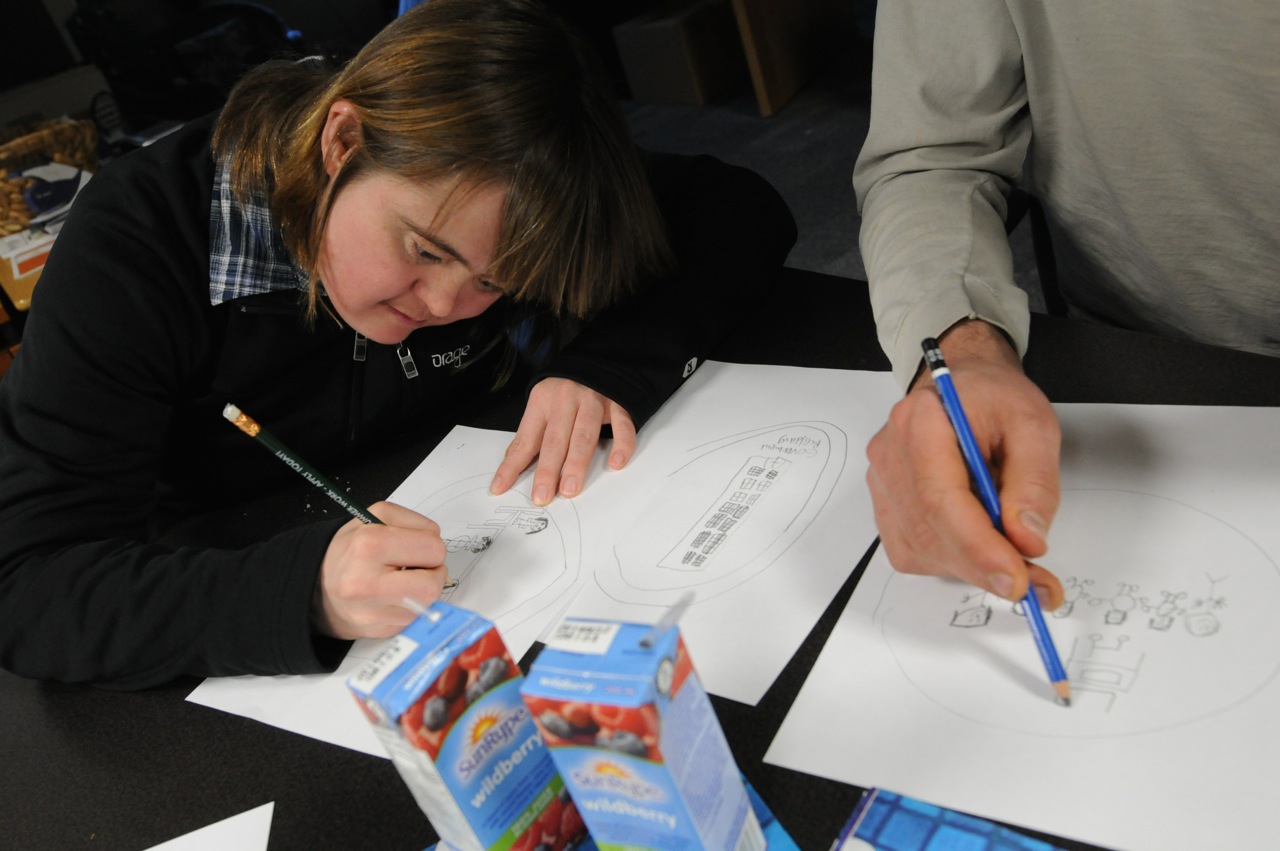
Participants were asked to draw pictures representing the five stakeholder groups. The drawings formed the basis for the icons used on the map markers. Photo courtesy the SpICE Lab (Spatial Information for Community Engagement)


By Naomi Bloch

In British Columbia, researchers have been using a crowdsourced mapping tool to capture positive employment experiences of individuals with intellectual disabilities. Geothink co-applicant Jon Corbett, an associate professor at the University of British Columbia’s Okanagan campus, is one of several UBC contributors to the participatory research project. Recently, the group published findings from its two-year pilot program.

The project is a collaboration between government agencies, the University of British Columbia, as well as self-advocates with intellectual disabilities and community partners. It demonstrates how government and citizens can employ the geoweb and participatory mapping to address community issues. “What we wanted to do specifically,” said Corbett, “was create a crowdsourced tool that would enable people to share their positive experiences, so that other people with intellectual disabilities and their family members and employers and also service providers could come to the site and they could actually see examples of positive employment. And so then they could emulate that, and they could strategize around that.”

This required developing an online environment that could engage all the identified stakeholder groups. To accomplish this, the initiative turned to the GeoLive participatory mapping tool, developed by Corbett’s Spatial Information for Community Engagement (SpICE) Lab. The GeoLive platform is a key component of a number of Geothink partner projects.

According to Corbett, GeoLive was initially conceived as a means to better support excluded and marginalized populations. “We know that when we share information on the cloud we have no idea how that information will be re-purposed, re-used, or stored,” Corbett said. “It can reappear in ways where we might least expect it in the future. So we wanted to get away from that and provide a certain level of guarantee that the information that people shared through the map is actually uniquely stored on our own servers, and should they wish to delete it they can delete it and it will be deleted forever.”

Corbett and GeoLive programmer Nick Blackwell are able to work directly with community members to customize the platform based on user needs. The software, which is built around the familiar Google Maps API,  is now used both by community groups as well as academic researchers. In the process of working with their inclusive employment partners, Corbett and his colleagues gained new insights regarding some of the usability challenges on the participatory geoweb. These included spatial literacy issues, the need to make the platform more mobile-friendly and less reliant on keyboard interaction, as well as accommodating users who have limited familiarity with today’s social media conventions.

Self advocates with intellectual disabilities and other stakeholders collaborated with Corbett’s team to design, evaluate, and further customize the online mapping tool. The group then worked with individuals and organizations throughout the province to collect stories of successful and inclusive employment. Over eighty narratives are now included on the map. While some markers have simple text descriptions, others include video, audio, as well as photos.

The map now serves as a shared space for community engagement. At the same time, university researchers associated with the project have been able to analyze the collected stories to identify some of the common features described in participants’ positive employment experiences. Map contributors discuss issues such as the challenges of finding a job, as well as the social and practical factors that create an enriching work environment. These findings are expected to help inform best practice guidelines that can support employment services for people with intellectual disabilities in the future.

The map is now public, and anyone can contribute their own relevant experiences or explore other people’s stories at http://www.mappinginclusiveemployment.ca/.

Reference: Hole, R., Corbett, J., Cook, S., & de Raaf, S. (2015). Mapping inclusive employment practices for individuals with developmental disabilities: A participatory research mapping project. The BC Centre for Employment Excellence, 32 pages.

If you have thoughts or questions about this article, get in touch with Naomi Bloch, Geothink’s digital journalist, at naomi.bloch2@gmail.com.

Twitter Chat: Civic Participation on the Geoweb

We Grow Food Trading Table ...   #FoodisFree #WeGrowFood

For her Ph.D. research, Victoria Fast explored how urban food assets can be crowdsourced onto the geoweb — civic participation in action.

All cylinders were firing by the time we wrapped up our Nov. 23 Twitter chat on meaningful civic participation on the geoweb. There were many parallel conversations that we hope will continue among participants and the wider Geothink community into the future. Here we share a few highlights, as well as a transcript of the chat.

  • We should ask what criteria define “civic participation”? Even passive or unknowing involvement may qualify as meaningful participation.
  • Intermediaries (infomediaries) are major mediators of the geoweb — leading projects, supporting learning, and providing citizens with tools and open data access. Librarians were identified as important infomediaries.
  • The geoweb can enable citizen participation on all levels of ‘meaning’. Yet we need to be mindful of who is being left out & not blame the excluded.
  • There can be different benefits from short-term engagements such as hackathons and long-term involvement such as contributing to OpenStreetMap. But both can trigger enduring civic interest.
  • It can be useful to consider when geoweb contributions using open data do not qualify as civic participation.
  • Both time-decay (sustainability) and distance-decay (activities concentrating around intermediary’s location) are issues that can affect civic participation on the geoweb.

Transcript


Spotlight on Recent Publications: Open Data and Official Language Regimes

screenshotCanadian  open government website

The bilingual federal Open Government portal

By Naomi Bloch

Teresa Scassa is a Geothink co-applicant researcher and Canada Research Chair in Information Law at the University of Ottawa. In a recently published paper, Scassa and co-author Niki Singh consider some of the challenges that arise for open data initiatives operating in multilingual regions. The authors use Canada’s federal open data initiative as a case study to examine how a government body in an officially bilingual jurisdiction negotiates its language obligations in the execution of its open data plan.

The article points out two areas for potential concern. First, private sector uses of government data could result in the unofficial outsourcing of services that otherwise would be the responsibility of government agencies, “thus directly or indirectly avoiding obligations to provide these services in both official languages.” Second, the authors suggest that the push to rapidly embrace an open data ethos may result in Canada’s minority language communities being left out of open data development and use opportunities.

According to Statistics Canada’s 2011 figures, approximately 7.3 million people — or 22 percent of the population — reported French as their primary language in Canada. This includes over a million residents outside of Quebec, primarily in Ontario and New Brunswick. Canada’s federal agencies are required to serve the public in both English and French. This obligation is formalized within Canada’s Charter of Rights and Freedoms, as well as the Official Languages Act. Government departments are provided with precise guidelines and frameworks  to ensure that they comply with these regulatory requirements in all of their public dealings and communications.

Scassa and Singh reviewed the various components of the federal open data initiative since the launch of the program to determine how well it is observing bilingual requirements. The authors note that while the open data infrastructure as a whole largely adheres to bilingual standards, one departure is the initiative’s Application Programming Interface (API). An API provides a set of protocols and tools for software developers. In this case, the API supports automated calls for open data housed in government databases. According to the authors, “As this open source software is not developed by the federal government, no bilingualism requirements apply to it.” While professional developers may be accustomed to English software environments even if they are francophones, the authors point out that this factor presents an additional barrier for French-language communities who might wish to use open data as a civic tool.

In their analysis of the data portal’s “apps gallery,” Scassa and Singh observed that the majority of apps or data tools posted thus far are provided by government agencies themselves. These offerings are largely bilingual. However, at the time of the authors’ review, only four of the citizen-contributed apps supported French. In general, public contributions to the federal apps gallery are minimal compared to government-produced tools.

As part of their analysis, the authors also looked at the two Canadian Open Data Experience (CODE) hackathon events sponsored by the government in order to promote civic engagement with open data. Communications leading up to the events were provided in English and French. Government documentation also indicated strong participation from Quebec coders at the CODE hackathons, though native language of the coders is not indicated. Interestingly, the authors note, “In spite of the bilingual dimensions of CODE it has produced apps that are for the most part, English only.”

The 2015 event, which was sponsored by government but organized by a private company, had a bilingual website and application process. However, Scassa and Singh found that social media communications surrounding the event itself were primarily in English, including government tweets from the Treasury Board Secretariat. Given this, the authors question whether sufficient effort was made to attract French-Canadian minorities outside of Quebec, and if specific efforts may be needed to gauge and support digital literacy in these minority communities.

While it is still early days for Canada’s open data initiative, this case study serves to highlight the challenges of supporting an open data platform that can meet both legal obligations and broader ethical objectives. The authors conclude that, “In a context where the government is expending resources to encourage the uptake and use of open data in these ways, the allocation of these resources should explicitly identify and address the needs of both official language communities in Canada.”

Abstract

The open data movement is gathering steam globally, and it has the potential to transform relationships between citizens, the private sector and government. To date, little or no attention has been given to the particular challenge of realizing the benefits of open data within an officially bi- or multi-lingual jurisdiction. Using the efforts and obligations of the Canadian federal government as a case study, the authors identify the challenges posed by developing and implementing an open data agenda within an officially bilingual state. Key concerns include (1) whether open data initiatives might be used as a means to outsource some information analysis and information services to an unregulated private sector, thus directly or indirectly avoiding obligations to provide these services in both official languages; and (2) whether the Canadian government’s embrace of the innovation agenda of open data leaves minority language communities underserved and under-included in the development and use of open data.

Reference: Scassa, T., & Singh, Niki. (2015). Open Data and Official Language Regimes: An Examination of the Canadian Experience. Journal of Democracy & Open Government, 7(1), 117–133.

If you have thoughts or questions about this article, get in touch with Naomi Bloch, Geothink’s digital journalist, at naomi.bloch2@gmail.com.

GIS & the Global Community: Humanitarian Mapping

Image of KLL team on balcony of new headquarters

KLL team outside their new headquarters. Photo courtesy Kathmandu Living Labs.

By Naomi Bloch


Today, November 18, marks the 16th annual GIS Day. Throughout the week, Geothink has been presenting a series of posts looking at some of the ways in which our collaborators, partners, and friends around the world are critically examining and using GIS as a tool for civic engagement and understanding.
The community snapshots presented this week highlight diverse perspectives and uses for GIS. We conclude our series with the following piece on humanitarian mapping and OpenStreetMap.

This past March, Nama Budhathoki, a long-time contributor to OpenStreetMap, announced his candidacy for the Humanitarian OpenStreetMap Team (HOT) Board of Directors. Budhathoki, the executive director of Nepal’s Kathmandu Living Labs (KLL), posted a manifesto that — in the months following Nepal’s April 25 earthquake — seemed beyond prescient. In it, he proposed his vision for HOT, and for the crowdsourced mapping community around the world.

Budhathoki’s principal message is two-fold. 1) Humanitarian mapping can be more effective by transitioning from being primarily a reactive community to one that encourages mapping communities to develop where they’re most needed — before crisis strikes. 2) A unique benefit of crowdsourced mapping stems from its role in community engagement and capacity building.

OpenStreetMap’s U.S. Chapter is a Geothink partner. Geothink recently caught up with Budhathoki while he was visiting Washington D.C. as the invited featured speaker at the launch of Mapping for Resilience: Turning Data into Decisions, a new program that aims to support geospatial data development in areas of need using OpenStreetMap.

Mapping as civic engagement

The challenge that KLL has been addressing for several years now in Kathmandu is the lack of decent spatial data and maps for the region. The small team has been tackling the problem by collaborating with educational institutions in Nepal, training students how to map their local environment in OpenStreetMap. In 2013, for example, they went out into the field to collect exposure data at the individual building level for over 2,000 schools, colleges and universities, as well as 350 health facilities in Kathmandu Valley. They mapped this data on OpenStreetMap so that the information could be downloaded and used by government and other organizations developing risk assessments and plans.

For Budhathoki, the act of mapping is a mechanism for engaging citizens and building local knowledge and awareness. “I keep emphasizing this, but I can’t stress it enough. Mapping is not just about the final product — you know, the map itself. The act of mapping is important; it’s about engaging the community,” Budhathoki said. “In the process of conducting these activities, you are talking to people in the community, sensitizing them to the issues, preparing them in advance to think about it.”

Budhathoki notes that one of the most important reasons to have active, capable mapping communities on the ground in high-risk regions is so that they can build trust within their communities before disaster strikes. “KLL has been working with the government, working with organizations in the community, and with different aid organizations for several years,” Budhathoki said. “So when the earthquake hit, we not only had the local knowledge and the capacity so that we could open the situation room within 24 hours of the earthquake, but we also had the trust of all these organizations. In my experience, this element of trust is very important.”

Mobilizing the global community

Within 48 hours following the first earthquake, over 1,500 mappers around the world had responded to the call to support Nepal. Kathmandu Living Labs coordinated the effort together with HOT. This October, KLL posted a timeline capturing the milestones of their six-month journey since April.

As is typically the case on crowdsourced projects, while some contributors signed on only briefly, other mappers dedicated themselves to the cause. These core mappers, Budhathoki believes, tended to be those with a longer history on OSM and HOT projects, because they typically have a better understanding of the types of commitments and challenges involved.

“In principle, because OSM is a crowdsourcing geo platform, it is by definition designed to have a low barrier to entry,” Budhathoki explained. “Anyone should be able to begin mapping. That’s in principle. But in reality, there are tasks that require more knowledge. So for example, users with more OpenStreetMap experience handle validation tasks.

“GIS experts anywhere in the world should be able to adapt to the OpenStreetMap environment even if it is new for them. For GIS experts, OSM is a pretty simple tool, generally. They can contribute expertise that is useful, that contributes to quality of the information. But not everyone is comfortable in a crowdsourced environment.”

Where local meets global

Geothink co-applicant Claus Rinner, a professor and chair of Ryerson University’s Department of Geography and Environmental Studies, coordinated several Mapping for Nepal workshops in Toronto after the first quake struck. Rinner worked with a group of students with varying degrees of mapping experience as well as local GIS professionals to help map the affected areas. Following his experiences, he posted some reflections regarding the current slippery boundaries between traditional GIS and OpenStreetMap as a crowdsourced mapping platform — and highlighted the need for more formal education opportunities that incorporate OSM as a tool. More recently, Rinner noted that high school students have been expressing an interest in Ryerson’s mapping events for Nepal. “My main observation here is that OSM/HOT mapping is a type of community activity that uses the students’ study-related expertise,” Rinner said, “rather than being something that anyone could do.”

Budhathoki sees the work of the global OSM community as valuable on a number of levels, but also highlights the importance of local knowledge. “Virtual mappers without advanced knowledge can do fundamental tasks like mapping the road network,” Budhathoki said, “but then who can provide the name of the road? It’s the local community. And different countries categorize roads differently, so it is difficult to know what road is a highway, for example. You can’t just assume this based on the width of the road.

“So, local understanding is always going to be important — particularly in these situations, where the information is needed by humanitarian organizations and is being used on the ground right away.”

If you have any questions for Nama or the KLL team, you can reach them on Twitter here: @KTMLivingLabs

To get a quick sense of KLL and OSM’s work in Nepal since April, check out the Kathmandu Living Labs: Six-Months of Earthquake Response timeline.


If you have thoughts or questions about this article, get in touch with Naomi Bloch, Geothink’s digital journalist, at naomi.bloch2@gmail.com.

GIS on Campus: Join Claus Rinner for GIS Day at Ryerson

By Naomi Bloch


This Wednesday, November 18, marks the 16th annual GIS Day. Throughout the week, Geothink will present a series of posts looking at some of the ways in which our collaborators, partners, and friends around the world are critically examining and using GIS as a tool for civic engagement and understanding.
The community snapshots presented this week highlight diverse perspectives and uses for GIS. 

If you’re looking for a way to introduce friends to the wide-ranging sphere of GIS, look no further than Toronto’s Ryerson University campus on Wednesday.

Geothink’s Claus Rinner along with GIS and Map Librarian Dan Jakubek have a full afternoon of events scheduled for GIS Day. They’ve lined up three keynote presentations, each of which will explore very different GIS applications: Senior Landscape Ecologist Dr. Namrata Shrestha will discuss her work with the Toronto & Region Conservation Authority; Andrew Lyszkiewicz from the City of Toronto’s Information & Technology Division brings in the municipal GIS perspective; while the Toronto Star’s Matthew Cole and William Davis are on hand to cover the growing role of GIS, mapping, open data, and data analysis in the media.

Apart from keynotes, there will be a poster session, geovisualization project displays, as well as several practical demonstrations of GIS and geoweb tools in action. Neptis Foundation, a Geothink partner, is one of the participating organizations. According to the Neptis Foundation’s Adrien Friesen, he and colleague Vishan Guyadeen will be demonstrating their soon-to-be-launched geoweb platform, “an integrative web mapping tool for the Greater Golden Horseshoe, created to help residents, researchers and decision makers better understand what shapes our urban and rural environments. It allows users to select different spatial layers that they can overlay and view different infrastructure, political boundaries, and protected areas (among many other things), to visualize the region in which they live.”

A full itinerary of the afternoon’s events can be found on the Geospatial Map & Data Centre website. While you’re on campus, you might want to check out the Geospatial Map & Data Centre itself. Ryerson Library’s communal lab is a dedicated space designed to support collaborative work with GIS, data, and related geospatial and statistical software packages.

Date: Wednesday, November 18, 2015
Time: 1:00 pm–5:00 pm
Location: Library Building, LIB-489, 4th Floor, 350 Victoria Street

For more of Geothink’s GIS Day coverage, see:

If you have thoughts or questions about this story, get in touch with Naomi Bloch, Geothink’s digital journalist, at naomi.bloch2@gmail.com.


GIS in the City: Toronto on the Map

Map of Toronto school nutrition program distributionBy Naomi Bloch


This Wednesday, November 18, marks the 16th annual GIS Day. Throughout the week, Geothink will present a series of posts looking at some of the ways in which our collaborators, partners, and friends around the world are critically examining and using GIS as a tool for civic engagement and understanding.
The community snapshots presented this week highlight diverse perspectives and uses for GIS. 

If you make your way to Toronto’s City Hall on Wednesday, you’ll discover that the City is displaying a slideshow of some pretty interesting maps, just above the 3D model of the downtown core. The big-screen projection, set up for Geography Awareness Week and GIS Day, showcases some of the ways that Toronto’s municipal divisions are using GIS to tackle urban issues.

These same projects can also be perused at your leisure via a new City of Toronto GIS Day landing page. The City of Toronto is one of Geothink’s municipal partners.

City of Toronto's Ventilation Index map. All images © City of Toronto 1998-2015. Used with permission.

City of Toronto’s Ventilation Index map. All images © City of Toronto 1998-2015. Used with permission.

The breadth of projects may surprise Toronto residents. Take the Environment and Energy Division’s (EED) Ventilation Index. The EED is mapping the city to get a full spatial understanding of areas known as “urban canyons,” narrow open spaces confined between built spaces that contribute to ground-level pollution — a problem most noticeable to pedestrians in the city. The higher the ventilation index, the greater the level of pollution. The Ventilation Index researchers’ goal is to try to identify “how the City’s changing building profile may have growing adverse effects at ground level and how to mitigate and adapt to the rapidly growing City.”

The City’s uses of GIS extend beyond urban planning or trying to understand how urban design impacts the environment. The Department of Public Health, for example, is employing GIS to better understand the distribution and funding of school nutrition programs. In 2014, 160,000 Toronto students participated in breakfast, snack and lunch programs, provided in schools and community sites throughout the city. Public Health has mapped the locations where student nutrition programs were in effect in 2014, with each site categorized based on the funding source behind the program. Incorporating census data such as the Low Income Measure, they’ve identified where meal programs are located relative to the City’s designated Neighbourhood Improvement Areas. This spatial mapping of school nutrition programs helps the City to understand which communities remain under-served and where additional funding should be allocated.

Want to know more about how the City of Toronto is using GIS? Head to Metro Hall on Friday, Nov. 20, anytime between 8:00 am and 3:00 pm. A few staff members from the City’s Geospatial Competency Centre will be on hand to answer questions.

For more of Geothink’s GIS Day coverage, see:

If you have thoughts or questions about this story, get in touch with Naomi Bloch, Geothink’s digital journalist, at naomi.bloch2@gmail.com.


An Expert’s View on Civic Participation on the Geoweb

By Naomi Bloch


As an early warm-up to our November 23 Twitter chat — What does meaningful civic participation on the geoweb look like? — we asked Geothink Head Renee Sieber to share her perspective. Here are a few highlights.


word cloud

More access, more communication

I think we’re in an environment where we’ve really broadened opportunities for citizens to participate through social media, through these various kinds of devices that we have, so I think it’s very exciting.

It’s an opportunity for citizens to be engaged when they don’t necessarily have the time to attend a meeting. So they can both watch city activities online through their own dashboards or they can communicate as issues arise. Perhaps cities may wish to create polls of online sentiment; they want to alert citizens of emergency situations or of interesting happenings in the city.  —R.S.


Citizen–City connection

We can have citizens more fully engaged as members of the city in reporting, in monitoring events in real-time. People generally point to open 311 applications. Open 311 comes from an old telephone service where you could dial a short number, 311, and you could report a nuisance complaint. This has moved online. So the prototypical example is the pothole. You can report the pothole, you can report a missing street sign. This can be enormously helpful to cities because they have more real-time information for problems in the infrastructure. So that’s another kind of engagement.  —R.S.


Hackathons

… Citizens can find new and unusual ways to use data that comes out of cities, in ways that cities had never thought about before. So it’s a very exciting way for people—particularly techies—to get into the mechanisms of governance and the mechanisms of government.

So I think that this is a great time to engage physically and digitally about what’s happening in your own cities. There are obviously challenges that are paired with that.  —R.S.


Digital divides

One way that we frame technology is by saying that, “It’s so easy now that anyone can participate.” The flipside of that, unfortunately, is that if you cannot participate it’s your fault: “We made it easy for you, so if you don’t want to participate — or if you cannot or you didn’t choose to participate — in that particular poll, well, we can’t be responsible if we didn’t hear your voice.”

But that ignores all sorts of reasons that people cannot participate. The digital divide and digital inequities have not gone away, they merely shift and hide. So we can be relatively sure that a lot of people have e-mail, but in parts of rural Canada we can’t always be sure that people will have sustainable connections to the Internet, to broadband connections, to connections of a sufficient speed, to connections that persist over time as opposed to connections that drop out in the middle of an e-mail transmission or a call. That’s a real challenge if all of a sudden you decide to move a good portion of your citizen activity online; you cut out a large number of people.

We may say, “Oh great, we can build all these apps for smart phones.” Well, that of course presumes that people own smart phones, that people have data plans on smart phones, that people have sufficiently high speed connections on their phones so that they can transmit, upload and download data quite quickly. We can’t make those kinds of assumptions.  —R.S.


Persistent social divides & inequities

You have to couple that with persistent digital divides and divides in general. Why are we assuming that illiteracy has been abolished in North America? We know that people still are illiterate. The hallmark of these technologies is that they’re increasingly relying on the written word. You have a phone, and you think we’re going to interact with the phone via voice. But increasingly people use their phones with text. Well, if you can’t read then you can’t participate. If you cannot see, you cannot participate. So we have all sorts of inequities based on disabilities.

So we have to be in tune to that, even as we trumpet the increased advantages and increased opportunities for people to participate. There will be people who will still find it extraordinarily challenging. Obviously people are working on solutions, but we have to be mindful of this in our rush to embracing digital engagement completely.   —R.S.


Public space meets proprietary space

In terms of technologies and processes that are shaping these conversations, obviously social media and social networks have been incredibly important. We almost take for granted now that cities have Facebook pages—that departments in cities have Facebook pages. But that’s an odd concept when you step back and you think about it. That, (a) a city should have social media, and (b) that cities need to attach themselves to a specific proprietary network.

But the fact that cities are socially engaged via these platforms, that they actually spend the resources and see the need to have Facebook pages that are updated, that they have Twitter accounts, that they have YouTube channels, that they may be increasingly looking at applications like Meerkat and Periscope to allow for live streaming—that they may be incredibly concerned that applications like Meerkat and Periscope may be used to inadvertently live stream a conversation that they heretofore thought was private—I think these technologies have rapidly transformed the way that cities feel they must now be engaged with the public.

These technologies absolutely have technological implications and they have institutional implications as well. You have to have a person who updates your Facebook accounts. That takes some time to do. You may have to find someone who automates posting not only on Facebook, but to LinkedIn, to Twitter—that automation may require a systems administrator or coder employed by the city. The fact that cities now employ social media people, these are job titles that we did not see before: open data architects, CTO [chief technology officer] positions in cities. These are processes that have changed in cities.
—R.S.


Progress is not always made to measure

I think that in the future cities will increasingly start to grapple with what succeeds and fails. I think we’re in a publishing mode right now. I think that cities are doing all they can to keep up. So, the city has to publish as much data as it can on an open data platform. They have to engage in as many social media platforms as they can. I think they will increasingly need to take hard looks at what succeeds and what fails.

It is by no means easy to evaluate these platforms in terms of success and failure. What is an effective Facebook profile? How do you measure that? Do you measure it with “likes”? OK, that’s one very technical way of measuring it, but what does a “like” tell you about meaningful engagement? It might not tell you a lot.

So it’s easy to take the low-hanging fruit of measurements to determine whether platforms are successful or not. That may not be the right way to go. Cities are increasingly looking at analytics and predictive analytics to gauge the success of these various platforms and their engagement. But once again, that tends to based on what can easily be quantified.  —R.S.


Humanizing the city

A lot of engagement between cities and citizens is much more longitudinal. It happens slowly over time. Cities and citizens build up trust. Distrust is easily gained, and very hard to get rid of.

I’ve been talking about cities as these homogeneous unions. But there are people in cities; there are citizens employed by cities, and often it is the ways that individuals in city governments reach out to individual citizens or groups of citizens, building up those linkages—using these technological platforms to heterogenize the city [that builds trust].

So, we begin to see the city and we see government as people engaging, just like you. They’re engaging with you, as opposed to being just The State (and you always must have this opinion about The State, or be in opposition to The State, or protest The State).

So [citizens can] use these technologies to sort of reach in, and stop looking at it as a monolith and more as a group of people who really are in city government because they wanted to work with citizens; they wanted to work on issues that were important and very close to the people who live in their cities.  —R.S.

 Join us for our #Geothink Twitter chat on civic participation on the geoweb: Monday, November 23 at 1 p.m. Eastern Time.

GIS in the Classroom: Geography and the Law

GIS DayBy Naomi Bloch


This Wednesday, November 18, marks the 16th annual GIS Day. Throughout the week, Geothink will present a series of posts looking at some of the ways in which our collaborators, partners, and friends around the world are critically examining and using GIS as a tool for civic engagement and understanding.
The community snapshots presented this week highlight diverse perspectives and uses for GIS. 

Tenille Brown headshot

Tenille Brown, Ph.D. candidate in the University of Ottawa’s Faculty of Law

In the winter 2016 term, Geothink’s Tenille Brown, a Ph.D. candidate in the University of Ottawa’s Faculty of Law, will be teaching a new course called Law and Geography. The seminar course will be offered as a first-year elective option for J.D. students. “It’s really exciting because it will be the first law and geography course in a Faculty of Law in Canada that I am aware of,” said Brown.

The intention of the course is to introduce new law students to the emerging field of legal geography, which focuses on spatial and place-based aspects of law and legal regulation. The course description highlights several focus areas, including public and private spaces; property and the city; critical perspectives of identity, racism and the law; gender, property and the law; indigenous peoples and the environment; and globalization. “There’s a wide variety of topics,” said Brown, “and within that I have a couple of classes which will look at issues of GIS and a lot of the themes of Geothink in relation to legal geography scholarship and in relation to the law.”

Brown notes that GIS is addressed in the legal literature to some extent, but such discussion is in its nascent stages. For example, the field of technology law deals with liability issues in relation to GIS, and issues such as copyright and privacy. “And there’s a little bit of GIS analysis in relation to understanding crime, and criminality,” said Brown. “That’s a big area of research, but I think there are many, many, many GIS narratives which are not captured at all.”

All of these GIS-oriented legal issues will play a role in her course, however she’s also hoping to draw in some students who have previous practical experience with GIS technologies. “If there are students who have a particular interest in GIS or have skills in GIS, and they’re willing, then we can explore not just legal liability in relation to GIS but also, how can we use GIS to help the functioning of the legal system? So really opening it up for those skills to be brought into the classroom.”

“I’m interested in knowing how information about a place, which is maybe more than property-related, can influence how we regulate or understand a particular area of a city, for example,” Brown said. “How can we bring in different information about a city that is not captured by a property title deed, or a traditional survey that we might have? We see a lot of non-traditional information collection right now. That is, it’s non-traditional from a legal perspective — information about how people use a place. Typically the law doesn’t care about that. Typically the law just wants to know who has the title deed, and that’s it.”

Brown offers the example of First Nations groups in Canada, who are currently using GIS and GIS technologies to collect oral histories and map out their histories spatially. “There’s a big push from indigenous communities, and a willingness and a desire to engage with GIS technologies to capture these different narratives,” Brown said. “And they’re wanting to use it to support land claims. That’s their whole aim.

“So it’s important to figure out how modern information can be incorporated into a legal system which relies on historical treaties,” Brown explained. “There’s a lot of legal questions about using that information and the strength of that kind of information from an evidentiary perspective. The law has a very non-GIS approach — a non-tech approach — to adjudication. So I think one of the really important questions is, how can we get this modern GIS counter-narrative and make sure that it’s solid as evidence that is effective for the legal system?”

For Brown, encouraging students with a GIS or geography background to consider how their knowledge can contribute to the legal process is just one motivation for her course. “They’re first-year law students,” Brown said,  “so they’re just beginning to get to grips with what takes place in the Faculty of Law. They’re in shock a little bit, at this point. With this class, I’m really hoping to open it up for students that already have an undergraduate degree in something spatial-related. If there’s anyone who’s done work with GIS, that will definitely enrich the classes.”

Do you have questions about Tenille’s course or research? Contact her on Twitter at: @TenilleEBrown 
Tenille Brown is a PhD candidate in the Faculty of Law at the University of Ottawa. She is a Geothink student member, and a member of the university’s Human Rights Research and Education Centre. Her research is in the areas of legal geography, including property, spatial and citizen engagement in the Ottawa context.


For more of Geothink’s GIS Day coverage, see:

If you have thoughts or questions about this article, get in touch with Naomi Bloch, Geothink’s digital journalist, at naomi.bloch2@gmail.com.