Tag Archives: crowdsourcing

A New Narrative for Collecting Statistical Data: Statistics Canada’s Crowdsourcing Project

This is a guest post from Statistics Canada on their new initiative on crowdsourcing geospatial data

Statistics Canada’s crowdsourcing project offers an exciting new opportunity for the agency to collaborate with stakeholders and citizens to produce and share open data with the general public — that is to say, data that can be freely used and repurposed.

Data collection is evolving with technology; for example, paper-based and telephone surveys are increasingly replaced with online surveys. With an array of modern technologies that most Canadians can access, such as Web 2.0 and smartphones, a new mechanism for data sharing can be piloted through open data platforms that host online crowds of data contributors. This project provides insight into how Statistics Canada can adapt these modern technologies, particularly open source tools and platforms, to engage public and private stakeholders and citizens to participate in the production of official statistics.

For the pilot project, Statistics Canada’s goal is to collect quality crowdsourced data on buildings in Ottawa and Gatineau. The data include attributes such as each building’s coordinate location, address and type of use. This crowdsourced data can fill gaps in national datasets and produce valuable information for various Statistics Canada divisions.

On September 15, 2016, Statistics Canada launched a web page and communications campaign to inform and motivate the citizens of Ottawa and Gatineau to participate in the pilot project. This pilot project is governed and developed by Statistics Canada’s Crowdsourcing Steering Committee. Statistics Canada’s communications with the local OpenStreetMap (OSM) community and collaboration with stakeholders and municipalities have allowed the pilot project to succeed.

To crowdsource the data, the project uses OpenStreetMap, an open source platform that aims to map all features on the Earth’s surface through user-generated content. OSM allows anyone to contribute data and, under the Open Data Commons Open Database License (ODbL), anyone can freely use, disseminate and repurpose OSM data. In addition to the web page and campaign to encourage participation, Statistics Canada developed and deployed a customized version of OSM’s iD-Editor. This adapted tool allows participants to seamlessly add points of interest (POIs) and polygons on OSM. The platform includes instructions on how to sign up for OSM and how to edit, allowing anyone, whether tech-savvy or not, to contribute georeferenced data (Figure 1).

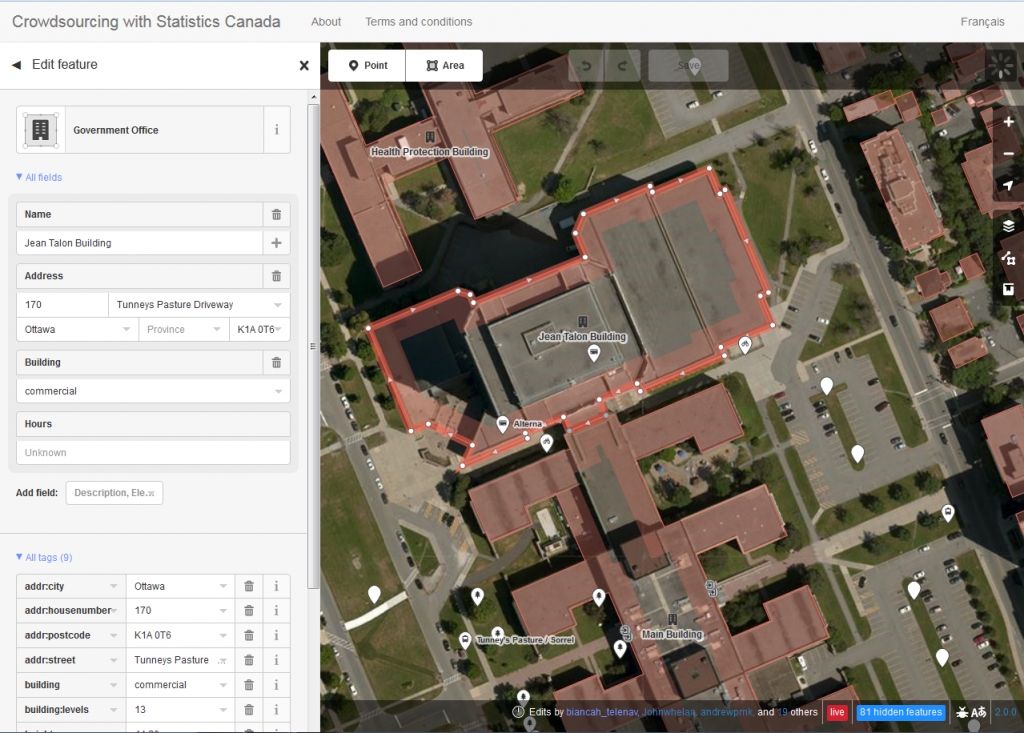
Figure 1. Snapshot of the customized version of OSM’s iD-Editor. Users can select a building or POI to see the attributes. Users can edit these attributes or they can create an entirely new point or area.

Statistics Canada has maintained communications with its stakeholders and participants through outreach, and has monitored contributions through dashboards. Outreach has taken place by communicating with the global and local OSM communities by using mailing lists and having local meetups, as well as by organizing webinars, presenting at local universities and participating in conferences associated with open data. Negotiation and collaboration with the City of Ottawa have also opened building footprints and addresses for contributors to add to the map.

The project has been monitored using an open source dashboard developed by Statistics Canada. The dashboard provides a timeline (currently covering August 2016 to February 15, 2017) that specifies the number of buildings mapped, the number of users and the average number of tags contributed on OSM in each target city. Furthermore, it shows the amount of certain building types (e.g., house, residential, commercial) and the number of missing address fields by percentage (Figure 2). In general, the dashboard highlights the increased OSM contributions in Ottawa and Gatineau since the initiation of the project.

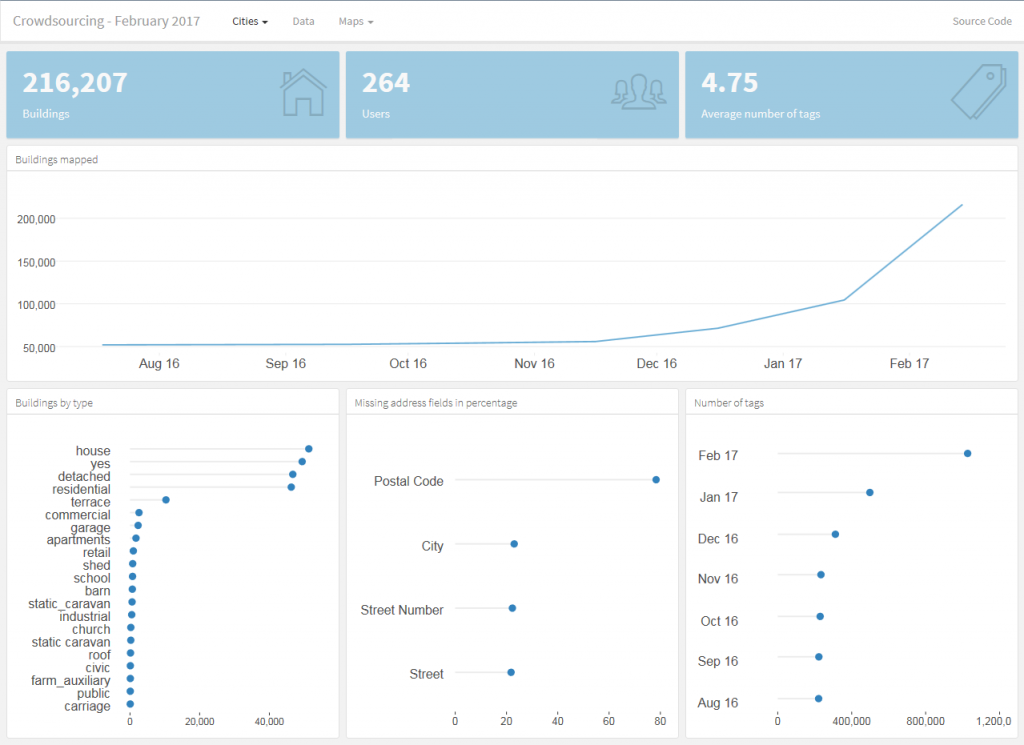
Figure 2. The open source dashboard monitors the production of data on OSM within the pilot project’s geographic scope of Ottawa and Gatineau. In the image above, both Ottawa and Gatineau have been selected. As seen in the top graph, buildings mapped in both cities have increased since the project’s initiation.

In the second year of the pilot project, Statistics Canada intends to develop a mobile app that will allow contributors to map on the go. Outreach will be maintained and, as more data are collected, quality assessments will be conducted. Success has been derived through collaborations, learning and sharing ideas, and developing user-friendly open source tools. As the project expands over time, Statistics Canada will uphold these values and approaches to ensure both an open and collaborative environment.

If you are interested in participating in the project, visit Statistics Canada’s Crowdsourcing website for a tutorial or to start mapping. Feel free to contact us at statcan.crowdsource.statcan@canada.ca to subscribe to a distribution list for periodic updates or to ask questions about the project.

Local News Map Will Be First To Highlight Disparities in Coverage Across Canada

The Local News Map launched by Geothink Co-Applicant Jon Corbett and Partner April Lindgren asks Canadian communities to report how news coverage has changed for them.

The Local News Map launched by Geothink Co-Applicant Jon Corbett and Partner April Lindgren asks Canadian communities to report how news coverage has changed for them.

By Drew Bush

The impact of newsroom cutbacks, consolidations, and closures across Canada will be the focus of a new crowdsourced online geoweb map. The public can contribute to it now—with the full map available online this June.

“The idea of the map is it will allow us to gather data that we have not been able to gather on our own just because there is so much data out there,” said Geothink Partner April Lindgren, an associate professor at Ryerson University’s School of Journalism and founding director of the Ryerson Journalism Research Centre.

The project stems from a belief that Canadians who live in smaller cities, suburban municipalities, and rural areas typically have fewer media outlets to turn to for media coverage. For that reason, the project’s list of communities includes municipalities that have experienced a major disruption in local news sources (such as the closure of a daily newspaper or television station).

The map will be one part of the project “Election News, local information and community discourse: Is Twitter the new public sphere?” that is headed by Jaigris Hodson, an assistant professor of Interdisciplinary Studies at Royal Roads University. Geothink Co-Applicant Jon Corbett, an associate professor in Community, Culture and Global Studies at the University of British Columbia, Okanagan, helped design it with his graduate students in the Spatial Information for Community Engagement (SPICE Lab) using the GeoLive platform featured in previous Geothink research.

“What we did is we went back to 2008 and we tried to find all the instances where a local news organization had either closed or scaled back service or something new had been launched,” Lindgren said in March while the map was being developed. “And so we populated the map as much as possible with information that we could find. But obviously there is lots and lots of other information out there that has happened since 2008. And there is probably lots of stuff going on right now that we do not know about.”

“So the idea of the crowdsourcing is it will allow us to obviously draw upon the expertise and knowledge of the local news landscape of people who live in communities,” she added. “And they will be able to contribute those pieces of information to the map to make it more robust and comprehensive.”

The map can document gains, losses, service increases, and service reductions at local online, radio, television and newspaper outlets across the country. Now that the map is open to contributions, members of the public can add information about changes to the local news landscape in their own communities. The map’s administrators will verify user submitted content so that the map remains accurate.


For a closer look at this project and the map, check out our video. In it, Corbett walks the user through a step-by-step view of the map and how to contribute while Lindgren discusses the importance of this work.


Making the Map

Many researchers have looked at the critical information needs of communities on topics such as education, health, security and emergency responses, Lindgren said. This in turn led her to think about how we know if there is adequate media provision in Canadian communities and where media have been lost or added. Still another related question is what online local news sites or social media have sprung up to fill any missing gaps.

Through attendance at last year’s Geothink Annual General Meeting in Waterloo, Lindgren was put in touch with Corbett. Eight months later, they had created a beta version of the map that included a couple hundred entries. Some emerging trends in the data include the consolidation and closure of community newspapers in Quebec and British Columbia.

“April had this idea that she wanted to better communicate information about how news media had changed over the period of the last eight years or so in Canada,” Corbett says of his meeting last May with Lindgren that began work by his lab to develop the map. “Because there really has been a lot of activity. Some newspapers have gotten larger. Others have closed down. There is a general move to web based media.”

His group has spent months ironing out the technical details of making this map presentable and ready for launch. Lindgren has provided feedback and advice on it through each stage.

“It has been an awful lot more complicated than we originally intended precisely because there has been so much activity and there is so much difference in this type of activity across Canada,” Corbett added. “For example, we have four major types of media. We have newspaper, we have radio, we have TV, and we have the web. And then within each one of those different types, we have a whole series of other information we need to convey.”

For example, the newspaper category of the map alone contains free dailies, free weeklies, and paid newspapers. It also must contain a measure of how such types have either declined or increased in different localities through time.

“And so we see all of this sort of compounding levels of complexity around the data that we need to present,” he said. “Because of course one of the problems with maps is to present information in an effective way require an awful lot of thought about the types of information being presented and how you actually present that type of information. It needs to be beautiful, it needs to be engaging, but it also needs to be informative.”

Corbett’s group has used color, typography, and more to make the map easily accessible to users. But he notes it is still a challenge to display all the transformations from January 2008 to the present. And the issue of time—as it is portrayed in the map—will only become more important as users begin to use it to display events taking place during specific years.

Getting Involved

Lindgren and Corbett are both excited for the map’s launch and the public’s participation. Right now the map needs richer input on new online news sites launched in Canada, Lindgren said. This is an issue she plans to keep an eye on when users begin contributing in greater frequency to determine to what extent these organizations are viable and fill gaps left by the closure of local newspapers and television stations.

Lindgren also believes the map has wide appeal to specific communities including local governments, individual community members, and journalists. She points out that in coming weeks there is a number of ways for the public to get involved.

“First of all, when they add a piece of data, they can comment,” Lindgren said. “Or they can comment on any other developments on the map that they want. And we have also incorporated a survey so that people can fill out the survey and tell us a little bit about where they go for their local news. Whether they feel adequately informed about various topics ranging from politics to education to other local issues.”

In case you missed it in the links above, find the map here to contribute your information: https://localnewsmap.geolive.ca/

###

If you have thoughts or questions about the article, get in touch with Drew Bush, Geothink’s digital journalist, at drew.bush@mail.mcgill.ca.

Crowdsourcing for better science and governance?

Screen Shot 2016-01-25 at 12.39.53 PM

Cornell University Lab of Ornithology’s E-Bird Web site allows citizen scientists to contribute data on birds for real scientific research as one novel application of crowdsourcing.

By Drew Bush

At Cornell University’s Lab of Ornithology, scientists have long benefited from the legions of enthusiasts who find joy in observing and reporting the birds they see during their daily routines. In 2002, the lab worked with the United States National Audubon Society to launch eBird, an online database where scientists and amateur naturalists can submit real-time observations of the birds they see and their behavior. Since 2013, scientists have benefited from more than 100,000,000 observations and data for over 10,240 species in the program generated by more than 100,000 users.

Often hailed as an application of crowdsourcing that democratizes science by giving citizens the power to contribute, E-Bird is emblematic of a recent trend in applying crowdsourcing to problems outside the for-profit, business sectors where it began. In Canada, a new Community Fishers application allows citizen scientists to collect oceanographic data for Ocean Networks Canada and a number of Canadian cities use PlaceSpeak to collect public opinions on topics related to given locations. In the United States, this trend has led to the introduction of the Crowdsourcing and Citizen Science Act. The bill’s author, Senator Chris Coons of Delaware, wrote in a Wired article this past September that his bill makes explicit “that executive branch agencies, commissions, and all military branches have the explicit authority to make use of crowdsourcing and citizen science projects, utilizing the resourcefulness and innovation of the public to solve problems.”

brabham-daren-500

Geothink researcher Daren Brabham is an assistant professor at the University of Southern California School for Communication and Journalism.

Geothink researcher Daren Brabham, an assistant professor at the University of Southern California School for Communication and Journalism, has long worked on research that supports this development. He is also widely credited as being the first to publish scholarly research that utilizes the word crowdsourcing. (Although he himself notes that one-time Wired editor Jeff Howe actually coined the term in a June 2006 issue where he wrote about Threadless.)

“I’ve got this kind of crazy idea for a citizen science kind of hub, you know call it for lack of a better term a [United States] citizen science corps for instance, or a North American citizen science corps,” Brabham said. “It would be a big program where all these scientific organizations could host—and also museums and researchers at state universities—could host their challenges that they want online communities to go do and solve these problems and gather scientific data in the community or whatever it might be. To post those in one single hub and find a way to gamify that where people can earn badges or level ups or even prizes for donors, or whatever it might be, to get people engaged in helping these organizations.”

Brabham believes crowdsourcing represents not only a tool to help scientists or the government do their work, but an opportunity to redefine what it means to provide service to one’s country—which in the past has been synonymous with military service. He envisions a future where if the United States National Aeronautics Administration (NASA) needs help analyzing water levels or categorizing stars by galaxy, they could involve thousands of citizen scientists in the project much like E-Bird does today.

Today’s trends in crowdsourcing mirror the evolution of his work. In particular, Brabham’s early work focused on applying crowdsourcing to uses in government, non-profits, and in public health. Many of these uses have since become common with, for example, the United States Office of Citizen Services and Innovative Technologies using DigitalGov to provide “information and services to the public anywhere and anytime.” In particular, one of its recent products, The Federal Community of Practice on Crowdsourcing and Citizen Science (CCS), works across the government to share lessons learned and develop best practices for designing, implementing, and evaluating crowdsourcing and citizen science initiatives.

Design Matters

Some of the key concerns for any crowdsourcing initiative, whether it be for urban planning, policy-making, or a for profit venture, is how to build a committed online community, sustain interest in it, and handle dissent amongst its users. Researchers on this subject seek to answer the question of what drives these communities to form and if design issues inhibit or accelerate this process.

For example, it’s difficult to know whether crowdsourced citizen science might succeed best if it involves primary school students in projects that count butterflies or instead utilizes iPhones to measure soil samples. It also helps to figure out why certain types of web-based platforms succeed at engaging communities while others have struggled. Brabham calls this type of assessment work “user-experience design,” which was a particular focus during Geothink’s 2015 Summer Institute.

In work he’s completed with other researchers, Brabham has found platforms that are easy to use, enjoyable, and have an intuitive interface have higher success rates. This may sound obvious but it’s more than just establishing a set of best practices for how all platforms should be designed. Instead, online sites must be organized according to the different tasks users are asked to complete or the different roles they might play.

For example, Brabham often talks about Threadless, a crowdsourced clothing and apparel site, and not just because his early involvement with it set him on his current research path after his now wife suggested he write a paper during his doctoral work applying this approach to sociocultural issues. In particular, he cites how Web sites like it give users a very clear idea of what audience it’s intended for, the activities the site allows users to undertake (shop, submit designs, or rate designs), and also includes a clear, user-friendly interface.

“I think when people are asked to contribute content or ideas or whatever it might be to a web site or organization in a crowdsourced arrangement, they really do care about how easy it is to convey their idea to you and figure out how it’s going to be used,” he said.

He points out that all too often researchers and critics focus on examining bad crowdsourcing initiatives rather than on what makes a given effort work. As crowdsourcing continues to be used in the public realm to help with citizen science efforts, paying attention to the details will become increasingly important. In particular, designers must provide users with multiple entry points, web sites with component parts organized based on tasks, and clear front pages that don’t overwhelm the average person.

A plethora of other issues surround both the implementation of crowdsourcing in public policy or for citizen science, and with its possible future uses. Brabham writes more about recent trends in the use of crowdsourcing in his recently published book: Crowdsourcing in the Public Sector. His earlier book, Crowdsourcing, is often cited for its importance in tracing crowdsourcing’s origins, future applications, and potential research paths.

If you have thoughts or questions about this article, get in touch with Drew Bush, Geothink’s digital journalist, at drew.bush@mail.mcgill.ca.

Twitter Chat: Civic Participation on the Geoweb

We Grow Food Trading Table ...   #FoodisFree #WeGrowFood

For her Ph.D. research, Victoria Fast explored how urban food assets can be crowdsourced onto the geoweb — civic participation in action.

All cylinders were firing by the time we wrapped up our Nov. 23 Twitter chat on meaningful civic participation on the geoweb. There were many parallel conversations that we hope will continue among participants and the wider Geothink community into the future. Here we share a few highlights, as well as a transcript of the chat.

  • We should ask what criteria define “civic participation”? Even passive or unknowing involvement may qualify as meaningful participation.
  • Intermediaries (infomediaries) are major mediators of the geoweb — leading projects, supporting learning, and providing citizens with tools and open data access. Librarians were identified as important infomediaries.
  • The geoweb can enable citizen participation on all levels of ‘meaning’. Yet we need to be mindful of who is being left out & not blame the excluded.
  • There can be different benefits from short-term engagements such as hackathons and long-term involvement such as contributing to OpenStreetMap. But both can trigger enduring civic interest.
  • It can be useful to consider when geoweb contributions using open data do not qualify as civic participation.
  • Both time-decay (sustainability) and distance-decay (activities concentrating around intermediary’s location) are issues that can affect civic participation on the geoweb.

Transcript


GIS & the Global Community: Humanitarian Mapping

Image of KLL team on balcony of new headquarters

KLL team outside their new headquarters. Photo courtesy Kathmandu Living Labs.

By Naomi Bloch


Today, November 18, marks the 16th annual GIS Day. Throughout the week, Geothink has been presenting a series of posts looking at some of the ways in which our collaborators, partners, and friends around the world are critically examining and using GIS as a tool for civic engagement and understanding.
The community snapshots presented this week highlight diverse perspectives and uses for GIS. We conclude our series with the following piece on humanitarian mapping and OpenStreetMap.

This past March, Nama Budhathoki, a long-time contributor to OpenStreetMap, announced his candidacy for the Humanitarian OpenStreetMap Team (HOT) Board of Directors. Budhathoki, the executive director of Nepal’s Kathmandu Living Labs (KLL), posted a manifesto that — in the months following Nepal’s April 25 earthquake — seemed beyond prescient. In it, he proposed his vision for HOT, and for the crowdsourced mapping community around the world.

Budhathoki’s principal message is two-fold. 1) Humanitarian mapping can be more effective by transitioning from being primarily a reactive community to one that encourages mapping communities to develop where they’re most needed — before crisis strikes. 2) A unique benefit of crowdsourced mapping stems from its role in community engagement and capacity building.

OpenStreetMap’s U.S. Chapter is a Geothink partner. Geothink recently caught up with Budhathoki while he was visiting Washington D.C. as the invited featured speaker at the launch of Mapping for Resilience: Turning Data into Decisions, a new program that aims to support geospatial data development in areas of need using OpenStreetMap.

Mapping as civic engagement

The challenge that KLL has been addressing for several years now in Kathmandu is the lack of decent spatial data and maps for the region. The small team has been tackling the problem by collaborating with educational institutions in Nepal, training students how to map their local environment in OpenStreetMap. In 2013, for example, they went out into the field to collect exposure data at the individual building level for over 2,000 schools, colleges and universities, as well as 350 health facilities in Kathmandu Valley. They mapped this data on OpenStreetMap so that the information could be downloaded and used by government and other organizations developing risk assessments and plans.

For Budhathoki, the act of mapping is a mechanism for engaging citizens and building local knowledge and awareness. “I keep emphasizing this, but I can’t stress it enough. Mapping is not just about the final product — you know, the map itself. The act of mapping is important; it’s about engaging the community,” Budhathoki said. “In the process of conducting these activities, you are talking to people in the community, sensitizing them to the issues, preparing them in advance to think about it.”

Budhathoki notes that one of the most important reasons to have active, capable mapping communities on the ground in high-risk regions is so that they can build trust within their communities before disaster strikes. “KLL has been working with the government, working with organizations in the community, and with different aid organizations for several years,” Budhathoki said. “So when the earthquake hit, we not only had the local knowledge and the capacity so that we could open the situation room within 24 hours of the earthquake, but we also had the trust of all these organizations. In my experience, this element of trust is very important.”

Mobilizing the global community

Within 48 hours following the first earthquake, over 1,500 mappers around the world had responded to the call to support Nepal. Kathmandu Living Labs coordinated the effort together with HOT. This October, KLL posted a timeline capturing the milestones of their six-month journey since April.

As is typically the case on crowdsourced projects, while some contributors signed on only briefly, other mappers dedicated themselves to the cause. These core mappers, Budhathoki believes, tended to be those with a longer history on OSM and HOT projects, because they typically have a better understanding of the types of commitments and challenges involved.

“In principle, because OSM is a crowdsourcing geo platform, it is by definition designed to have a low barrier to entry,” Budhathoki explained. “Anyone should be able to begin mapping. That’s in principle. But in reality, there are tasks that require more knowledge. So for example, users with more OpenStreetMap experience handle validation tasks.

“GIS experts anywhere in the world should be able to adapt to the OpenStreetMap environment even if it is new for them. For GIS experts, OSM is a pretty simple tool, generally. They can contribute expertise that is useful, that contributes to quality of the information. But not everyone is comfortable in a crowdsourced environment.”

Where local meets global

Geothink co-applicant Claus Rinner, a professor and chair of Ryerson University’s Department of Geography and Environmental Studies, coordinated several Mapping for Nepal workshops in Toronto after the first quake struck. Rinner worked with a group of students with varying degrees of mapping experience as well as local GIS professionals to help map the affected areas. Following his experiences, he posted some reflections regarding the current slippery boundaries between traditional GIS and OpenStreetMap as a crowdsourced mapping platform — and highlighted the need for more formal education opportunities that incorporate OSM as a tool. More recently, Rinner noted that high school students have been expressing an interest in Ryerson’s mapping events for Nepal. “My main observation here is that OSM/HOT mapping is a type of community activity that uses the students’ study-related expertise,” Rinner said, “rather than being something that anyone could do.”

Budhathoki sees the work of the global OSM community as valuable on a number of levels, but also highlights the importance of local knowledge. “Virtual mappers without advanced knowledge can do fundamental tasks like mapping the road network,” Budhathoki said, “but then who can provide the name of the road? It’s the local community. And different countries categorize roads differently, so it is difficult to know what road is a highway, for example. You can’t just assume this based on the width of the road.

“So, local understanding is always going to be important — particularly in these situations, where the information is needed by humanitarian organizations and is being used on the ground right away.”

If you have any questions for Nama or the KLL team, you can reach them on Twitter here: @KTMLivingLabs

To get a quick sense of KLL and OSM’s work in Nepal since April, check out the Kathmandu Living Labs: Six-Months of Earthquake Response timeline.


If you have thoughts or questions about this article, get in touch with Naomi Bloch, Geothink’s digital journalist, at naomi.bloch2@gmail.com.

Crosspost: Being Philosophical About Crowdsourced Geographic Information

This Geo: Geography and Environment blog post is cross-posted with permission from the authors, Renée Sieber (McGill University, Canada) and Muki Haklay (University College London, UK).
By Renée Sieber and Muki Haklay

Our recent paper, The epistemology(s) of volunteered geographic information: a critique, started from a discussion we had about changes within the geographic information science (GIScience) research communities over the past two decades. We’ve both been working in the area of participatory geographic information systems (GIS) and critical studies of geographic information science (GIScience) since the late 1990s, where we engaged with people from all walks of life with the information that is available in GIS. Many times we’d work together with people to create new geographic information and maps. Our goal was to help reflect their point of view of the world and their knowledge about local conditions, not always aim for universal rules and principles. For example, the image below is from a discussion with the community in Hackney Wick, London, where individuals collaborated to ensure the information to be captured represented their views on the area and its future, in light of the Olympic works that happened on their doorstep. The GIScience research community, by contrast, emphasizes quantitative modelling and universal rules about geographic information (exemplified by frequent mentioning of Tobler’s first law of Geography). The GIScience research community was not especially welcoming of qualitative, participatory mapping efforts, leaving these efforts mostly in the margins of the discipline.

Photo of 2007 participatory mapping contributors working together in Hackney Wick, London, 2007

Participatory Mapping in Hackney Wick, London, 2007

Around 2005, researchers in GIScience started to notice that when people used their Global Positioning System (GPS) devices to record where they took pictures or used online mapping apps to make their own maps, they were generating a new kind of geographic information. Once projects like OpenStreetMap and other user-generated geographic information came to the scene, the early hostility evaporated and volunteered geographic information (VGI) or crowdsourced geographic information was embraced as a valid, valuable and useful source of information for GIScience research. More importantly, VGI became an acceptable research subject, with subjects like how to assess quality and what motivates people to contribute.

This about-face was puzzling and we felt that it justified an investigation of the concepts and ideas that allowed that to happen. Why did VGI become part of the “truth” in GIScience? In philosophical language, the questions ‘where does knowledge come from? how was it created? What is the meaning and truth of knowledge?’ is known as epistemology and our paper evolved into an exploration of the epistemology, or more accurately the multiple epistemologies, which are inherent in VGI. It’s easy to make the case that VGI is a new way of knowing the world, with (1) its potential to disrupt existing practices (e.g. the way OpenStreetMap provide alternative to official maps as shown in the image below) and (2) the way VGI both constrains contributions (e.g., 140 chars) and opens contributions (e.g., with its ease of user interface; with its multimedia offerings). VGI affords a new epistemology, a new way of knowing geography, of knowing place. Rather than observing a way of knowing, we were interested in what researchers thought was the epistemology of VGI. They were building it in real-time and attempting to ensure it conformed to existing ways of knowing. An analog would be: instead of knowing a religion from the inside, you construct your conception of it, with your own assumptions and biases, while you are on the outside. We argue that construction was occurring with VGI.

OpenStreetMap mapping party (Nono Fotos)

OpenStreetMap mapping party (Nono Fotos)

We likewise were interested in the way that long-standing critics of mapping technologies would respond to new sources of data and new platforms for that data. Criticism tends to be grounded in the structuralist works of Michel Foucault on power and how it is influenced by wider societal structures. Critics extended traditional notions of volunteerism and empowerment to VGI, without necessarily examining whether or not these were applicable to the new ‘ecosystem’ of geospatial apps companies, code and data. We also were curious why the critiques focussed on the software platforms used to generate the data (e.g., Twitter) instead of the data themselves (tweets). It was as if the platforms used to create and share VGI are embedded in various socio-political and economic configurations. However, the data were innocent of association with the assemblages. Lastly, we saw an unconscious shift in the Critical GIS/GIScience field from the collective to the personal. Historically, in the wider field of human geography, when we thought of civil society mapping together by using technology, we looked at collective activities like counter-mapping (e.g., a community fights an extension to airport runway by conducting a spatial analysis to demonstrate the adverse impacts of noise or pollution to the surrounding geography). We believe the shift occurred because Critical GIS scholars were never comfortable with community and consensus-based action in the first place. In hindsight, it probably is easier to critique the (individual) emancipatory potential as opposed to the (collective) empowerment potential of the technology. Moreover, Critical GIS researchers have shifted their attention away from geographic information systems towards the software stack of geospatial software and geosocial media, which raises question about what is considered under this term. For all of these reasons and more we decided to investigate the “world building” from both the instrumentalist scientists and from their critics.

We do use some philosophical framing—Borgmann has a great idea called the device paradigm—to analyse what is happening, and we hope that the paper will contribute to the debate in the critical studies of geographical information beyond the confines of GIScience to human geography more broadly.

About the authors: Renée E. Sieber is an Associate Professor in the Department of Geography and the School of Environment at McGill University. Muki Haklay is Professor of Geographical Information Science in the Department of Civil, Environmental and Geomatic Engineering at University College London.

Geothink Video Interview 3: Our Experts Take on Crowdsourcing

Screen Shot 2016-02-24 at 8.34.20 PMBy Drew Bush

We’re excited to bring you our long-awaited video interview that features Geothink’s experts discussing issues of authenticity and accuracy with crowdsourced data.  Data collected through crowdsourcing methods increasingly has replaced traditional forms of data collection.

This video features Geothink Head Renee Sieber, associate professor in McGill University’s Department of Geography and School of Environment; Daren Brabham, assistant professor in the University of Southern California Annenberg School of Journalistm and Communication; Scott Bell, a professor of Geography and Planning at University of Saskatchewan; And, Claus Rinner,a professor and chair of Ryerson University’s Department of Geography and Environmental Studies.

We hope you enjoy this video as much as we enjoyed making it. Afterwards, leave us a comment and tell us what you think about this important area of debate concerning crowdsourced data.

You can also learn more about crowdsourcing by reading our post on this central topic to our 2015 Summer Institute, listening to these lectures from the Summer Institute, or listening to our experts talk about the topic over lunch last June. 

If you have thoughts or questions about this video, get in touch with Drew Bush, Geothink’s digital journalist, at drew.bush@mail.mcgill.ca.

Geothoughts Conversations 1: Debating and Defining the Emergent Field of Crowdsourcing Civic Governance

Our second Geothoughts Conversations piece takes a look at crowdsourcing, the topic of the 2015 Summer Institute.

Our first Geothoughts Conversations piece takes a look at crowdsourcing, the topic of the 2015 Summer Institute.

By Drew Bush

One of the hallmarks of any academic conference are the conversations that take place in-between sessions, in the hallways and over meals. In our first Geothink Conversations we aim to give you a flavor of these discussions at Geothink’s now concluded 2015 Summer Institute.

This month’s conversation features Geothink Head Renee Sieber, associate professor in McGill University’s Department of Geography and School of Environment; Robert Goodspeed, assistant professor of Urban Planning at the University of Michigan’s Taubman College of Architecture and Urban Planning; Daren Brabham, assistant professor in the University of Southern California Annenberg School of Journalism and Communication; and Monica Stephens, assistant professor in the Department of Geography at State University of New York at Buffalo. And, of course, I’m Drew Bush and I’ll be helping steer the conversation along.

Each day of the institute alternated morning lectures, panel discussions and in-depth case studies on topics in crowdsourcing with afternoon work sessions where professors worked with student groups one-on-one on their proposal to meet a challenge posed by the City of Ottawa. For more on the Institute, check out our web site at geothink.ca.

To start us off, Brabham gets the group rolling on what exactly defines the boundaries of crowdsourcing, the topic of many conversations overheard during the three-day conference.


If you have thoughts or questions about this podcast, get in touch with Drew Bush, Geothink’s digital journalist, at drew.bush@mail.mcgill.ca.