In this issue, we celebrate the start of a new year by reflecting upon five successful Geothink&Learn webinars and highlighting exciting new Geothink research.
We catch up with Geothink Co-Applicant Teresa Scassa about her work on data deficits
in the sharing economy; Geothink Collaborator Muki Haklay about his new open course
on Citizen Science; former Geothink student Julia Conzon about her recent appointment
at Employment and Social Development Canada; and other grant news.
If you have feedback or content for the newsletter, please contact the Editor, Sam Lumley.
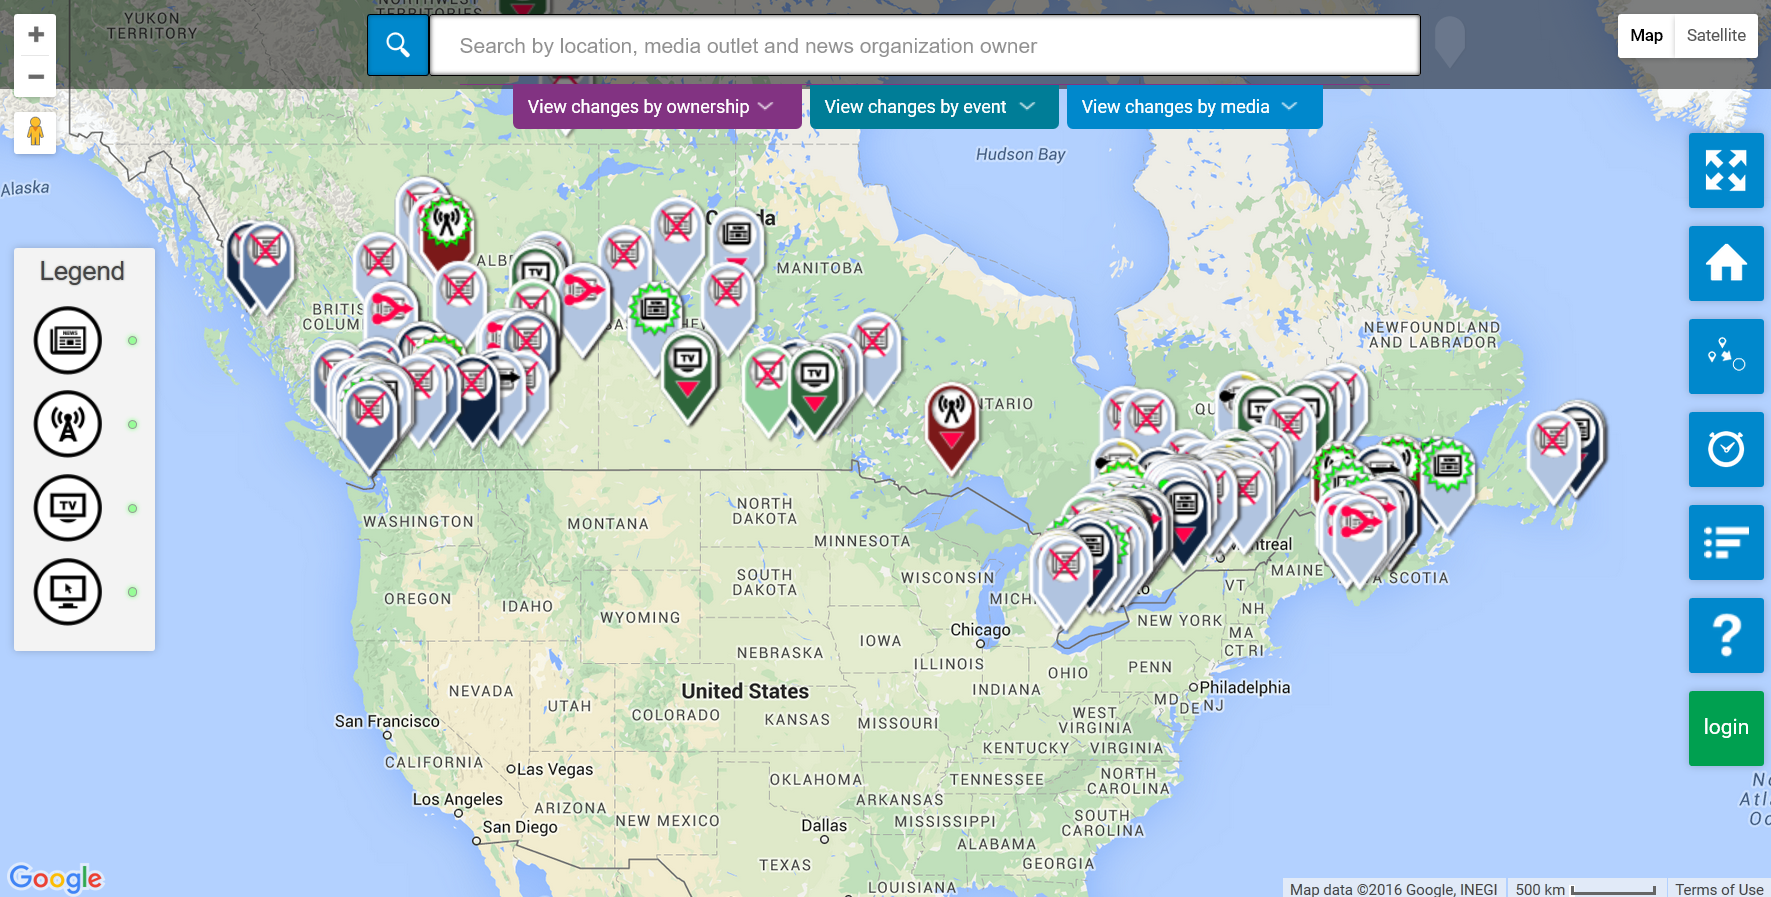
The Local News Map launched by Geothink Co-Applicant Jon Corbett and Partner April Lindgren asks Canadian communities to report how news coverage has changed for them.
By Drew Bush
The impact of newsroom cutbacks, consolidations, and closures across Canada will be the focus of a new crowdsourced online geoweb map. The public can contribute to it now—with the full map available online this June.
The project stems from a belief that Canadians who live in smaller cities, suburban municipalities, and rural areas typically have fewer media outlets to turn to for media coverage. For that reason, the project’s list of communities includes municipalities that have experienced a major disruption in local news sources (such as the closure of a daily newspaper or television station).
The map will be one part of the project “Election News, local information and community discourse: Is Twitter the new public sphere?” that is headed by Jaigris Hodson, an assistant professor of Interdisciplinary Studies at Royal Roads University. Geothink Co-Applicant Jon Corbett, an associate professor in Community, Culture and Global Studies at the University of British Columbia, Okanagan, helped design it with his graduate students in the Spatial Information for Community Engagement (SPICE Lab) using the GeoLive platform featured in previous Geothink research.
“What we did is we went back to 2008 and we tried to find all the instances where a local news organization had either closed or scaled back service or something new had been launched,” Lindgren said in March while the map was being developed. “And so we populated the map as much as possible with information that we could find. But obviously there is lots and lots of other information out there that has happened since 2008. And there is probably lots of stuff going on right now that we do not know about.”
“So the idea of the crowdsourcing is it will allow us to obviously draw upon the expertise and knowledge of the local news landscape of people who live in communities,” she added. “And they will be able to contribute those pieces of information to the map to make it more robust and comprehensive.”
The map can document gains, losses, service increases, and service reductions at local online, radio, television and newspaper outlets across the country. Now that the map is open to contributions, members of the public can add information about changes to the local news landscape in their own communities. The map’s administrators will verify user submitted content so that the map remains accurate.
For a closer look at this project and the map, check out our video. In it, Corbett walks the user through a step-by-step view of the map and how to contribute while Lindgren discusses the importance of this work.
Making the Map
Many researchers have looked at the critical information needs of communities on topics such as education, health, security and emergency responses, Lindgren said. This in turn led her to think about how we know if there is adequate media provision in Canadian communities and where media have been lost or added. Still another related question is what online local news sites or social media have sprung up to fill any missing gaps.
Through attendance at last year’s Geothink Annual General Meeting in Waterloo, Lindgren was put in touch with Corbett. Eight months later, they had created a beta version of the map that included a couple hundred entries. Some emerging trends in the data include the consolidation and closure of community newspapers in Quebec and British Columbia.
“April had this idea that she wanted to better communicate information about how news media had changed over the period of the last eight years or so in Canada,” Corbett says of his meeting last May with Lindgren that began work by his lab to develop the map. “Because there really has been a lot of activity. Some newspapers have gotten larger. Others have closed down. There is a general move to web based media.”
His group has spent months ironing out the technical details of making this map presentable and ready for launch. Lindgren has provided feedback and advice on it through each stage.
“It has been an awful lot more complicated than we originally intended precisely because there has been so much activity and there is so much difference in this type of activity across Canada,” Corbett added. “For example, we have four major types of media. We have newspaper, we have radio, we have TV, and we have the web. And then within each one of those different types, we have a whole series of other information we need to convey.”
For example, the newspaper category of the map alone contains free dailies, free weeklies, and paid newspapers. It also must contain a measure of how such types have either declined or increased in different localities through time.
“And so we see all of this sort of compounding levels of complexity around the data that we need to present,” he said. “Because of course one of the problems with maps is to present information in an effective way require an awful lot of thought about the types of information being presented and how you actually present that type of information. It needs to be beautiful, it needs to be engaging, but it also needs to be informative.”
Corbett’s group has used color, typography, and more to make the map easily accessible to users. But he notes it is still a challenge to display all the transformations from January 2008 to the present. And the issue of time—as it is portrayed in the map—will only become more important as users begin to use it to display events taking place during specific years.
Getting Involved
Lindgren and Corbett are both excited for the map’s launch and the public’s participation. Right now the map needs richer input on new online news sites launched in Canada, Lindgren said. This is an issue she plans to keep an eye on when users begin contributing in greater frequency to determine to what extent these organizations are viable and fill gaps left by the closure of local newspapers and television stations.
Lindgren also believes the map has wide appeal to specific communities including local governments, individual community members, and journalists. She points out that in coming weeks there is a number of ways for the public to get involved.
“First of all, when they add a piece of data, they can comment,” Lindgren said. “Or they can comment on any other developments on the map that they want. And we have also incorporated a survey so that people can fill out the survey and tell us a little bit about where they go for their local news. Whether they feel adequately informed about various topics ranging from politics to education to other local issues.”
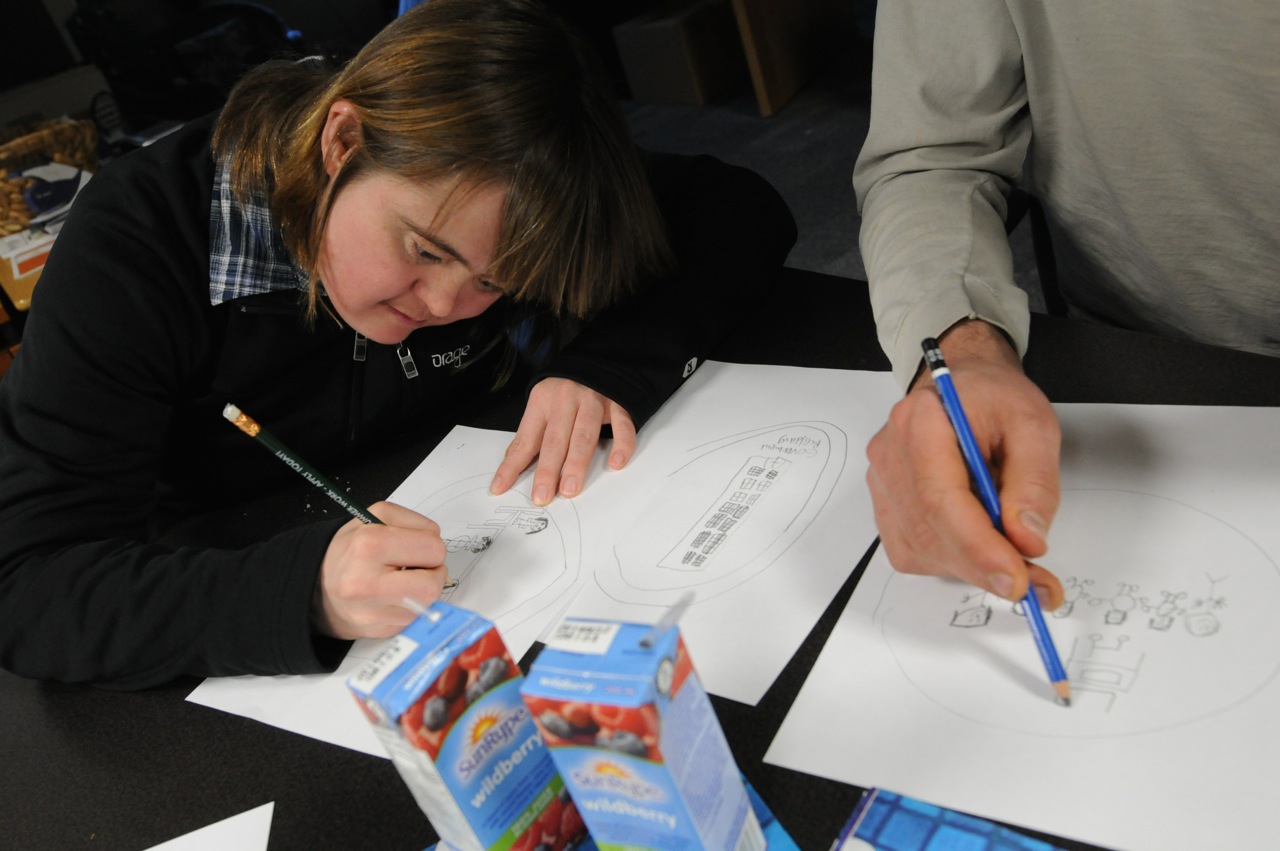
Participants were asked to draw pictures representing the five stakeholder groups. The drawings formed the basis for the icons used on the map markers. Photo courtesy the SpICE Lab (Spatial Information for Community Engagement)
By Naomi Bloch
In British Columbia, researchers have been using a crowdsourced mapping tool to capture positive employment experiences of individuals with intellectual disabilities. Geothink co-applicant Jon Corbett, an associate professor at the University of British Columbia’s Okanagan campus, is one of several UBC contributors to the participatory research project. Recently, the group published findings from its two-year pilot program.
The project is a collaboration between government agencies, the University of British Columbia, as well as self-advocates with intellectual disabilities and community partners. It demonstrates how government and citizens can employ the geoweb and participatory mapping to address community issues. “What we wanted to do specifically,” said Corbett, “was create a crowdsourced tool that would enable people to share their positive experiences, so that other people with intellectual disabilities and their family members and employers and also service providers could come to the site and they could actually see examples of positive employment. And so then they could emulate that, and they could strategize around that.”
This required developing an online environment that could engage all the identified stakeholder groups. To accomplish this, the initiative turned to the GeoLive participatory mapping tool, developed by Corbett’s Spatial Information for Community Engagement (SpICE) Lab. The GeoLive platform is a key component of a number of Geothink partner projects.
According to Corbett, GeoLive was initially conceived as a means to better support excluded and marginalized populations. “We know that when we share information on the cloud we have no idea how that information will be re-purposed, re-used, or stored,” Corbett said. “It can reappear in ways where we might least expect it in the future. So we wanted to get away from that and provide a certain level of guarantee that the information that people shared through the map is actually uniquely stored on our own servers, and should they wish to delete it they can delete it and it will be deleted forever.”
Corbett and GeoLive programmer Nick Blackwell are able to work directly with community members to customize the platform based on user needs. The software, which is built around the familiar Google Maps API, is now used both by community groups as well as academic researchers. In the process of working with their inclusive employment partners, Corbett and his colleagues gained new insights regarding some of the usability challenges on the participatory geoweb. These included spatial literacy issues, the need to make the platform more mobile-friendly and less reliant on keyboard interaction, as well as accommodating users who have limited familiarity with today’s social media conventions.
Self advocates with intellectual disabilities and other stakeholders collaborated with Corbett’s team to design, evaluate, and further customize the online mapping tool. The group then worked with individuals and organizations throughout the province to collect stories of successful and inclusive employment. Over eighty narratives are now included on the map. While some markers have simple text descriptions, others include video, audio, as well as photos.
The map now serves as a shared space for community engagement. At the same time, university researchers associated with the project have been able to analyze the collected stories to identify some of the common features described in participants’ positive employment experiences. Map contributors discuss issues such as the challenges of finding a job, as well as the social and practical factors that create an enriching work environment. These findings are expected to help inform best practice guidelines that can support employment services for people with intellectual disabilities in the future.
Reference: Hole, R., Corbett, J., Cook, S., & de Raaf, S. (2015). Mapping inclusive employment practices for individuals with developmental disabilities: A participatory research mapping project. The BC Centre for Employment Excellence, 32 pages.
If you have thoughts or questions about this article, get in touch with Naomi Bloch, Geothink’s digital journalist, at naomi.bloch2@gmail.com.
Today, November 18, marks the 16th annual GIS Day. Throughout the week, Geothink has been presenting a series of posts looking at some of the ways in which our collaborators, partners, and friends around the world are critically examining and using GIS as a tool for civic engagement and understanding.
The community snapshots presented this week highlight diverse perspectives and uses for GIS. We conclude our series with the following piece on humanitarian mapping and OpenStreetMap.
This past March, Nama Budhathoki, a long-time contributor to OpenStreetMap, announced his candidacy for the Humanitarian OpenStreetMap Team (HOT) Board of Directors. Budhathoki, the executive director of Nepal’s Kathmandu Living Labs (KLL), posted a manifesto that — in the months following Nepal’s April 25 earthquake — seemed beyond prescient. In it, he proposed his vision for HOT, and for the crowdsourced mapping community around the world.
Budhathoki’s principal message is two-fold. 1) Humanitarian mapping can be more effective by transitioning from being primarily a reactive community to one that encourages mapping communities to develop where they’re most needed — before crisis strikes. 2) A unique benefit of crowdsourced mapping stems from its role in community engagement and capacity building.
OpenStreetMap’s U.S. Chapter is a Geothink partner. Geothink recently caught up with Budhathoki while he was visiting Washington D.C. as the invited featured speaker at the launch of Mapping for Resilience: Turning Data into Decisions, a new program that aims to support geospatial data development in areas of need using OpenStreetMap.
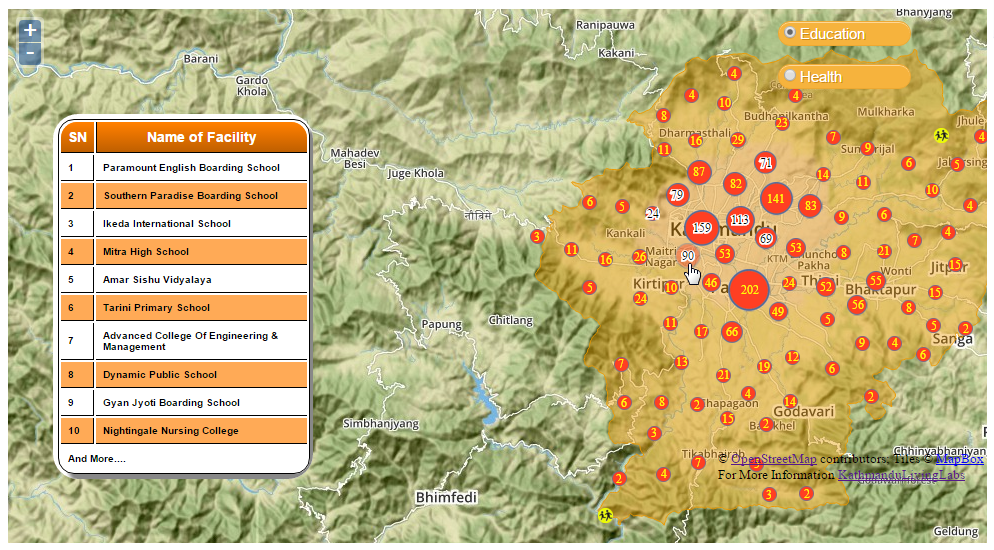
The challenge that KLL has been addressing for several years now in Kathmandu is the lack of decent spatial data and maps for the region. The small team has been tackling the problem by collaborating with educational institutions in Nepal, training students how to map their local environment in OpenStreetMap. In 2013, for example, they went out into the field to collect exposure data at the individual building level for over 2,000 schools, colleges and universities, as well as 350 health facilities in Kathmandu Valley. They mapped this data on OpenStreetMap so that the information could be downloaded and used by government and other organizations developing risk assessments and plans.
For Budhathoki, the act of mapping is a mechanism for engaging citizens and building local knowledge and awareness. “I keep emphasizing this, but I can’t stress it enough. Mapping is not just about the final product — you know, the map itself. The act of mapping is important; it’s about engaging the community,” Budhathoki said. “In the process of conducting these activities, you are talking to people in the community, sensitizing them to the issues, preparing them in advance to think about it.”
Budhathoki notes that one of the most important reasons to have active, capable mapping communities on the ground in high-risk regions is so that they can build trust within their communities before disaster strikes. “KLL has been working with the government, working with organizations in the community, and with different aid organizations for several years,” Budhathoki said. “So when the earthquake hit, we not only had the local knowledge and the capacity so that we could open the situation room within 24 hours of the earthquake, but we also had the trust of all these organizations. In my experience, this element of trust is very important.”
Mobilizing the global community
Within 48 hours following the first earthquake, over 1,500 mappers around the world had responded to the call to support Nepal. Kathmandu Living Labs coordinated the effort together with HOT. This October, KLL posted a timeline capturing the milestones of their six-month journey since April.
As is typically the case on crowdsourced projects, while some contributors signed on only briefly, other mappers dedicated themselves to the cause. These core mappers, Budhathoki believes, tended to be those with a longer history on OSM and HOT projects, because they typically have a better understanding of the types of commitments and challenges involved.
“In principle, because OSM is a crowdsourcing geo platform, it is by definition designed to have a low barrier to entry,” Budhathoki explained. “Anyone should be able to begin mapping. That’s in principle. But in reality, there are tasks that require more knowledge. So for example, users with more OpenStreetMap experience handle validation tasks.
“GIS experts anywhere in the world should be able to adapt to the OpenStreetMap environment even if it is new for them. For GIS experts, OSM is a pretty simple tool, generally. They can contribute expertise that is useful, that contributes to quality of the information. But not everyone is comfortable in a crowdsourced environment.”
Where local meets global
Geothink co-applicant Claus Rinner, a professor and chair of Ryerson University’s Department of Geography and Environmental Studies, coordinated several Mapping for Nepal workshops in Toronto after the first quake struck. Rinner worked with a group of students with varying degrees of mapping experience as well as local GIS professionals to help map the affected areas. Following his experiences, he posted some reflections regarding the current slippery boundaries between traditional GIS and OpenStreetMap as a crowdsourced mapping platform — and highlighted the need for more formal education opportunities that incorporate OSM as a tool. More recently, Rinner noted that high school students have been expressing an interest in Ryerson’s mapping events for Nepal. “My main observation here is that OSM/HOT mapping is a type of community activity that uses the students’ study-related expertise,” Rinner said, “rather than being something that anyone could do.”
Budhathoki sees the work of the global OSM community as valuable on a number of levels, but also highlights the importance of local knowledge. “Virtual mappers without advanced knowledge can do fundamental tasks like mapping the road network,” Budhathoki said, “but then who can provide the name of the road? It’s the local community. And different countries categorize roads differently, so it is difficult to know what road is a highway, for example. You can’t just assume this based on the width of the road.
“So, local understanding is always going to be important — particularly in these situations, where the information is needed by humanitarian organizations and is being used on the ground right away.”
If you have any questions for Nama or the KLL team, you can reach them on Twitter here: @KTMLivingLabs
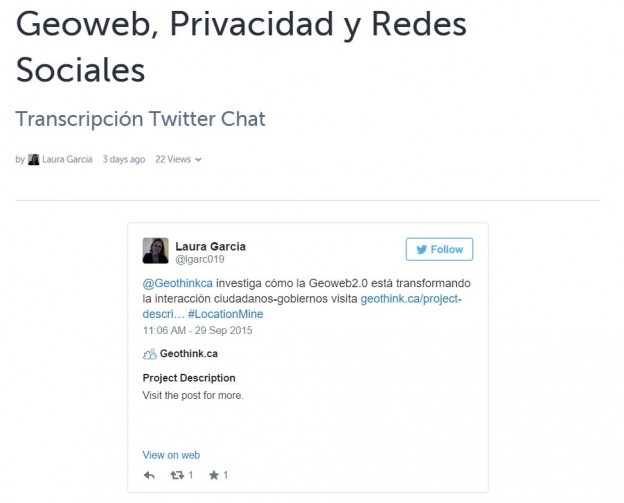
Laura Garcia, PhD student at the University of Ottawa under Prof. Elizabeth Judge (University of Ottawa), recently conducted a Spanish language Twitter chat with students at Los Andes University.
Discussion revolved around privacy issues especially in location-based services on the Geoweb 2.0. Using the hashtag #locationmine, participants discussed how location is both ‘mine’ in the sense of being very personal and private information and a mine of data to be exploited. Protecting privacy requires education, laws, regulation, and maybe even changes to technologies (such as the creation of standards). We are in the midst of changes in the technological landscape that are already having an effect on the amount of privacy internet users can realistically have, and this will continue into the future. Not only is technology changing, our habits are also changing as well, resulting in many agreeing to terms of use without a proper examination or thought over the details. Locational privacy must be debated and defined as a response to changes in the ecosystem, to enable proper regulation and protection of rights.
Laura presented the discussants with five conclusions:
One of the most important elements of the right to privacy is for the user to have control over the information shared and who has access this information
It is not easy to find and/or remove the collection of geographic information made automatically by some technologies and companies. Therefore, in these cases the user does not have control over the collection of their locational information
It is important for the users of the Geoweb to take an active role in the protection of their privacy
Better regulations are needed. These need to be mandatory and unambiguous
Civil society needs to advocate for its own rights and demand corporate social responsibility
“From a GIS, GIScience perspective, I sort of went extreme in the access to location, or the location aspects of access. So looking at the arrangements of doctors just to get a sense of, just at the physical level, is there an equitable arrangement of doctors. And we know pretty clearly that that’s not true across Canada, at different scales and at the scale of the nation.”
To draw this conclusion, Bell brings a Geographic Information Systems (GIS) perspective to the context of a broad variety of areas of interest in human health. For example, he has collaborated on interdisciplinary health, environmental, and social science research that uses both public and private data.
“My interest in health really has broadened areas of interest to look at access to a variety of things that effect our health.”
This year alone he has worked with the University of Saskatchewan’s College of Dentistry and also examined the accessibility of Canadian food in terms of finding healthy eating options. But collecting such data can sometimes be onerous work owing to the fact that different provincial colleges of physicians and surgeons have varying standards for their data, he must collect population data from Statistics Canada for comparison, and sometimes he might even collect his own data using surveys to gain insight.
“So we integrate data across a variety of sources, mostly publicly available not always in the sort of true and honest definition of open data…We collect our own sometimes using telephone surveys of people to get an idea of what’s controlling or what’s affecting their access to healthcare.”
What’s important is figuring out what particular issues might impact how people access doctors. These include aspects of a given doctor’s services, such as the number of patients they take, or the personal concerns of the consumer or patient.
“We as just members of the public when we look for a doctor, access can be affected by our own personal opinions, or beliefs, or worldviews, or preferences. So if I prefer to be seen by a male doctor and my neighborhood is filled with female doctors, a physical measure of access might show that there are lots of doctors near me and I should have great accessibility. But I’m not willing to see any of those doctors.”
[Geothink.ca theme music]
[Voice over: Geothoughts are brought to you by Geothink.ca and generous funding from Canada’s Social Sciences and Humanities Research Council.]
###
If you have thoughts or questions about this podcast, get in touch with Drew Bush, Geothink’s digital journalist, at drew.bush@mail.mcgill.ca.
Scott Bell is a professor in the Department of Geography and Planning at the University of Saskatchewan.
If you ask a Canadian what makes them most proud of their country, free and easily accessible healthcare would often be near the top of the list. But for one Geothink researcher, this commonly held narrative has been disproven and led him to help those in need of better healthcare.
“People in the north and some rural areas just don’t have that many doctors per person or have very low rates of doctors per 1,000 people,” Scott Bell, a professor of Geography and Planning at University of Saskatchewan, said. “And I think one of the things that really captured my interest here is that as Canadians and in Canada, we sort of expect equitable healthcare. And I think a lot of people—who have easy access to healthcare, are happy with their doctor’s care, and their ability to make appointments, and things like that—don’t think too much about the fact that not all Canadians have access to the free healthcare services we should all have access to. So that’s kind of a guiding principle.”
To draw the above conclusions, Bell brings a Geographic Information Systems (GIS) perspective to examine a broad variety of areas in human health. For example, he has collaborated on interdisciplinary health, environmental, and social science research that uses both public and private data including from surveys he has conducted himself and data he’s collected from provincial colleges of physicians and surgeons.
To get a sense of which populations are being served or not served by healthcare, his research compares the above data against population data from Statistics Canada (particularly, he says, the 2006 Long Form Census). This year he has worked with the University of Saskatchewan’s College of Dentistry and also examined the accessibility of Canadian food in terms of finding healthy eating options.
“My interest in health research really is focused on disparities in accessibility, and accessibility is a word that people use in day-to-day conversations a lot,” he told Geothink. “In terms of health, it’s a pretty complicated concept that is related not just to services themselves, where and when they’re available, when a clinic might be open, and how many doctors are there, and how many bookings they can take, or have open for drop-in or scheduling. But is also related to the patients themselves.”
It’s these consumer issues that can complicate how healthcare services can be made more accessible.
“Access can be affected by our own personal opinions, or beliefs, or worldviews, or preferences,” he said. “So if I prefer to be seen by a male doctor and my neighborhood is filled with female doctors, the physical measure of access might show that there are lots of doctors near me and I should have great accessibility. But I’m not willing to see any of those doctors.”
He has also found that when GIS is used to look at extreme situations in specific locations in Canada by just the arrangement of doctors, it’s not true that everyone has access to healthcare across the country. But identifying such a problem by locating those most in need often is the first step in starting a conversation to correct such problems.
If you have thoughts or questions about this article, get in touch with Drew Bush, Geothink’s digital journalist, at drew.bush@mail.mcgill.ca.
Jon Corbett is an associate professor in the University of British Columbia’s Community, Culture and Global Studies program and co-director of the Centre for Social, Spatial and Economic Justice.
By Drew Bush
In our daily usage, most maps contain a logical representation of a city’s streets or a forest’s hiking trails that allows us to safely navigate to new locations. For many indigenous and excluded populations, maps can play a more fundamental role.
Jon Corbett, an Associate Professor in Community, Culture and Global Studies at the University of British Columbia, has spent decades investigating how cartographic processes and tools used by local communities help express their relationships to and knowledge of land and resources. Corbett has worked in Australia, Indonesia, the Philippines, and in British Columbia with several First Nations communities.
“Often maps, although they are powerful tools, they don’t tell the full story because a lot of indigenous knowledge and a lot of local knowledge is tied up in storytelling, and histories, and is built around specific landmarks within a particular town within a particular place,” he told Geothink last June.
To better capture this relationship with the land, Corbett and his graduate student Nicholas Blackwell first began building their Geolive platform in 2008. Geolive is an online interactive mapping interface based on the Google Maps API that allows administrators to create public maps and place user-generated information on those maps while users can add content and communicate.
In other words, users of this platform can add attributes to specific locations on the map using text, photos, video or other media to show how specific places get used by the community. As the platform has gotten more sophisticated, users have gained the ability to moderate each other, filter info with key words, and use mobile devices to contribute short videos or photos.
The most important element is that users take ownership of the place they live and contribute important local knowledge. Corbett got his start doing this type of work before programs such as Google Earth existed. In fact, he literally used sticks, sand and stones when he began thinking about how to empower often excluded communities with maps during his Ph.D. research in Borneo.
“I am really interested in how maps can become transformative agents in change, particularly social change,” he said. “So my research in the past has involved working with a lot of excluded populations, often indigenous population in different places in the world. Looking at how mapping can become a tool to express a different relationship, or a different set of experiences, or a different set of stories as it relates to that particular group and the land on which they live.”
His work has evolved from using sketch mapping where participants draw rivers, streets, and watershed boundaries from memory to scale mapping where they add or fill in locally-based information on scale maps or three-dimensional modelling where participants build a physical, tactile terrain map. Of the digital, he comments that some elements can be lost from a process that once involved using what was on the ground.
“There is this funny thing that occurs as you move from more tactile, more tangible forms of participation mapping into the digital world,” he said after enumerating the many advantages of digital mapping with communities. “In a sense, your own relationship to those types of projects diminishes as you become more virtual.”
If you have thoughts or questions about this article, get in touch with Drew Bush, Geothink’s digital journalist, at drew.bush@mail.mcgill.ca.