This issue marks the halfway point for the grant. Included are some reflections on our progress, as well as features on our researchers.
If you have feedback or content for the newsletter, please contact the editor, Peck Sangiambut.
This issue marks the halfway point for the grant. Included are some reflections on our progress, as well as features on our researchers.
If you have feedback or content for the newsletter, please contact the editor, Peck Sangiambut.

This July, Alberta residents were warned that drivers who use Uber’s car-sharing service may not have appropriate insurance coverage, with potential risks to both drivers and passengers.
By Naomi Bloch
The rise of the web-enabled sharing economy is leading to much hope about potentially new sources of income and new ways for communities to connect and share resources. In the process, however, more consumers appear to be turning to global tech companies to acquire convenient, local services.
This July, Alberta residents were warned that drivers who use Uber’s car-sharing service may not have appropriate insurance coverage, with potential risks to both drivers and passengers. Earlier this month in Ontario’s Kitchener-Waterloo region, the local cab company Waterloo Taxi released its new mobile app. The company hopes the app will help it to maintain its edge against Uber, a recent—and not entirely legal—entry to the local marketplace. Meanwhile, starting this fall, Quebec will begin regulating the online home rental service Airbnb.
In this podcast, we interview Geothink co-applicant Leslie Regan Shade, associate professor in the University of Toronto’s Faculty of Information. Together with PhD candidate Harrison Smith, Shade has been exploring the “cartographies of sharing,” situating the geoweb in the sharing economy of Canada. Shade is particularly interested in the political economic questions now surfacing in the media, in policy circles, and in academia. She and Smith are focusing on three inter-related questions:
If you have thoughts or questions about this podcast, get in touch with Naomi Bloch, Geothink’s digital journalist, at naomi.bloch2@gmail.com.
 By Drew Bush
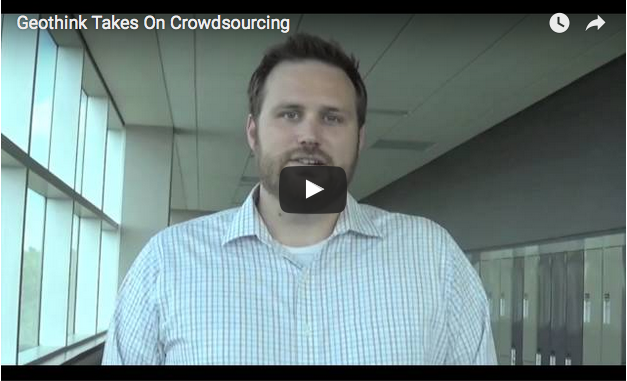
We’re excited to bring you our long-awaited video interview that features Geothink’s experts discussing issues of authenticity and accuracy with crowdsourced data. Data collected through crowdsourcing methods increasingly has replaced traditional forms of data collection.
This video features Geothink Head Renee Sieber, associate professor in McGill University’s Department of Geography and School of Environment; Daren Brabham, assistant professor in the University of Southern California Annenberg School of Journalistm and Communication; Scott Bell, a professor of Geography and Planning at University of Saskatchewan; And, Claus Rinner,a professor and chair of Ryerson University’s Department of Geography and Environmental Studies.
We hope you enjoy this video as much as we enjoyed making it. Afterwards, leave us a comment and tell us what you think about this important area of debate concerning crowdsourced data.
You can also learn more about crowdsourcing by reading our post on this central topic to our 2015 Summer Institute, listening to these lectures from the Summer Institute, or listening to our experts talk about the topic over lunch last June.
If you have thoughts or questions about this video, get in touch with Drew Bush, Geothink’s digital journalist, at drew.bush@mail.mcgill.ca.
This post is cross-posted with permission from April Lindgren and Christina Wong at Local News Research Project.
By April Lindgren and Christina Wong
Introduction
Concerns about how neighbourhoods are portrayed in the news have surfaced regularly in the Toronto area over the years. But are those concerns valid?
Interactive maps produced by the The Local News Research Project (LNRP) at Ryerson University’s School of Journalism are designed to help Toronto residents answer this question. The maps give the public access to data the research project collected on local news coverage by the Toronto Star and the online news website OpenFile.ca. The maps can be used by members of the public and researchers to:
The maps are based on the Toronto Star’s local news coverage published on 21 days between January and August, 2011. Researchers have found that a two-week sample of news is generally representative of news coverage over the course of a year (Riffe, Aust & Lacy, 1993). The data for OpenFile.ca, which suspended publishing in 2012, were collected for every day in 2011 between January and August.
Click here to see the maps or continue reading to find out more about news coverage and neighbourhood stereotyping, how the maps work, and the role of open data sources in this project.
Local news and neighbourhood stereotyping
The decision to explore news coverage of Toronto neighbourhoods was prompted by concerns expressed by citizens and local politicians about how certain parts of the city are portrayed in the local media. Residents were furious (Pellettier, Brawley & Yuen, 2013), for instance, when Toronto Star columnist Rosie Dimanno referred to the city’s Scarborough area as “Scarberia” in an article about former mayor Rob Ford’s re-election campaign (DiManno, 2013). Back in 2007, then-mayor David Miller went so far as to contact all of the city’s news media asking them to cite the nearest main intersection rather than reporting more generally that a particular crime occurred in Scarborough (Maloney, 2007). In Toronto’s west end, the local city councillor suggested negative connotations associated with the Jane and Finch neighbourhood could be diffused by renaming it University Heights, but the idea was vehemently rejected by residents (Aveling, 2009).
A study that investigated how Toronto’s most disadvantaged neighbourhoods were covered by the Toronto Star concluded that there was very little coverage of news in these communities (Lindgren, 2009). The study, which examined Toronto Star local news reporting in 2008, also found that crime tended to dominate the limited coverage that did take place and suggested the problem could be rectified not by ignoring crime stories, but by increasing coverage of other sorts of issues in those communities.
Exploring the maps
The interactive maps allow users to explore local news coverage in the City of Toronto. A sample of local stories and photographs from the Toronto Star (the local newspaper with the largest circulation in the city) and OpenFile.ca (a community-based news website) were identified and analyzed in 2011 to capture data about story topics and mentions of geographic locations.
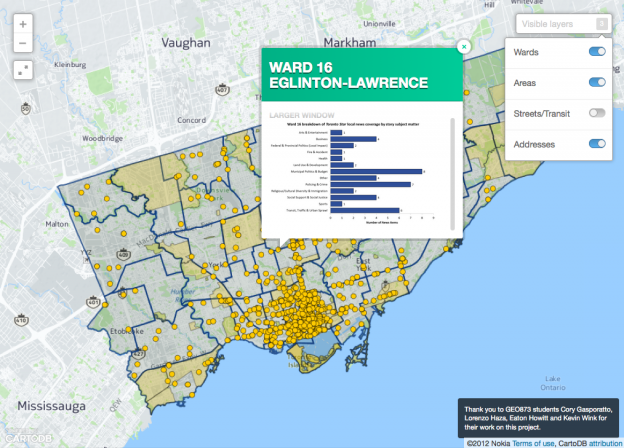
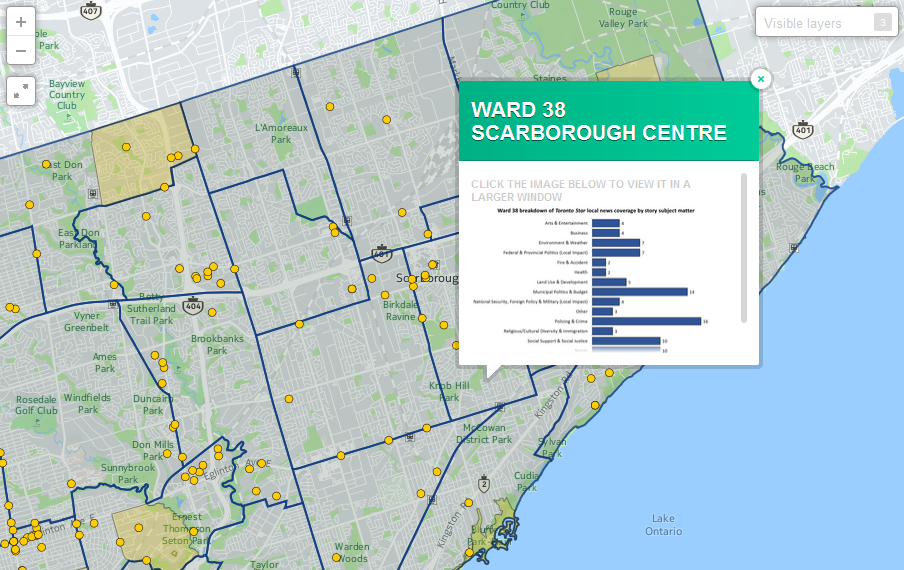
These maps make the data available to the public in a way that allows users to explore and compare media coverage in different areas of the city. Users can zoom in on a neighbourhood and discover all of the locations referenced within a neighbourhood. Each point on the map represents a location that was referenced in one or more news items. Users can click on any of these points to see a list of news articles associated with each location (Figure 1).
By clicking within a ward boundary, users can also access a summary chart describing the breakdown by subject of all local news coverage in that ward. Users interested in the Scarborough area, for instance, can zoom into that area on the map and click on each Scarborough ward to see what sorts of stories (crime, transit, entertainment, sports, etc.) were reported on in that ward (Figure 2).
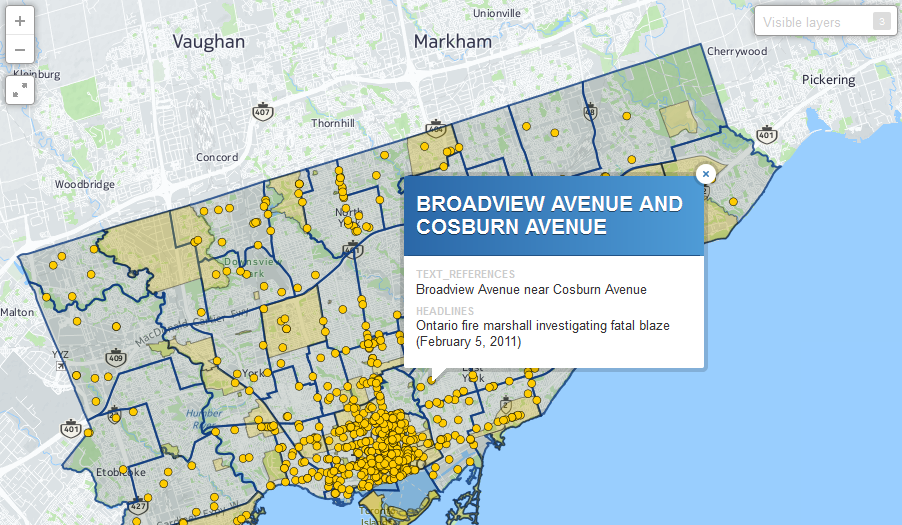
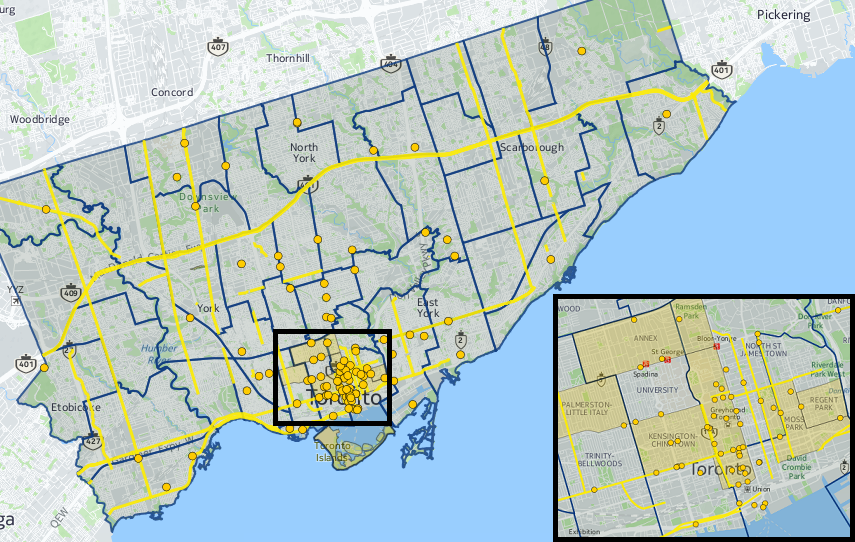
Users interested in how and where a particular news topic is covered can access separate interactive maps for the top five subjects covered by the two news sources. Figure 3, for example, shows all locations mentioned in crime and policing stories published by the Toronto Star during the study’s sample period.
The role of open data sources in creating these maps
A total of 23 pre-existing datasets were used to support the creation of these interactive maps including relevant open datasets that were publically available online in 2008. The datasets were used to populate a list of geographic locations in the GTA that had the potential to be referenced in local news stories. Each dataset was assigned unique numerical codes and all 23 datasets were appended to a geographic reference table that coders could search. The incorporated reference list of geographic locations and features allowed for a more accurate and efficient coding process: Coders entering information about spatial references in local news items were able to select many of the referenced geographic locations from the pre-populated list rather than entering the information manually. This improved accuracy because it helped prevent human error and also sped up the coding process.
We would have preferred to use more open data sources during the initial development of the database, but this wasn’t possible due to limited availability of datasets with the spatial attributes that make mapping possible. At that time, only two of the 23 datasets used (approximately 8.7% of the total) were available from open data sources in a format that included geography (such as shapefiles). Both files were obtained from the City of Toronto’s Open Data website. These limitations meant that the majority of the database relied on contributions from private data sources.
The situation has improved over time as more open government data become available in geographic file formats that support research with spatial analysis. As of mid-2015, six more of the 23 datasets (two federal, one provincial and three municipal) used in the database have become available. If we were creating the database today, a total of eight datasets or 34.8% of the initial database could be populated using open data sources (Table 1).
| Table 1. Availability of open data sources | ||
| Available in 2008 when the database was created | Currently available | |
| Private sources | 21 | 15 |
| Government open data | 2 (8.7% of database) | 8 (34.8% of database) |
| Total # of datasets | 23 | 23 |
Since 2008, the Government of Canada has launched its own open data portal, joined the Open Government Partnership alongside other countries supporting the release of open government data, and adopted the G8 Open Data Charter (Standing Committee on Government Operations and Estimates, 2014). Provincial and municipal governments have made similar improvements to open data access. The Government of Ontario launched an online open data catalogue in 2012 and is currently developing an Open Data Directive to be implemented later this year (Fraser, 2015). The City of Toronto introduced its open data portal in 2009 and developed an Open Data Policy in 2012 (City of Toronto, n.d.).
As Table 1 suggests, however, further improvements are required to reduce barriers to research and innovation. A report from the Standing Committee on Government Operations and Estimates, for instance, recommended that the federal government provide data at smaller levels of geography, work together with different levels of government to establish standards and release data, and provide a greater variety of open data to reflect all government departments. The report noted that the release of open data can improve government efficiency, foster citizen engagement, and encourage innovation (Standing Committee on Government Operations and Estimates, 2014). Academic researchers have argued that improvements in the availability of open government data would stimulate valuable research and outcomes with economic and social value (Jetzek, Avital & Bjorn-Andersen, 2014; Kucera, 2015; Zuiderwijk, Janssen & Davis, 2014). Journalists are also pushing for easier and greater access to data (Schoenhoff & Tribe, 2014).
Conclusion
Research conducted by the Local News Research Project was made possible by public funds and as such the data should be widely available. The interactive maps are an attempt to fulfill that obligation.
While the maps capture only a snapshot of news coverage at a fixed point in time, they nonetheless demonstrate the importance of geospatial analysis in local news research (Lindgren & Wong, 2012). They are also a powerful data visualization tool that allows members of the public to independently explore media portrayals of neighbourhoods and the extent to which some parts of a city are represented in the news while others are largely ignored.
Finally, this mapping project also illustrates how open government data can foster research and how much there is still to do in terms of making data available to the public in useful formats.
The Local News Research Project was established in 2007 to explore the role of local news in communities. Funding for this research has been provided by Ryerson University, CERIS-The Ontario Metropolis Centre and the Social Sciences and Humanities Research Council.
About the authors: Lindgren is an Associate Professor in Ryerson University’s School of Journalism and Academic Director of the Ryerson Journalism Research Centre. Christina Wong is a graduate of Ryerson University’s Geographic Analysis program. Initial work on the maps was done in 2014 by GEO873 students Cory Gasporatto, Lorenzo Haza, Eaton Howitt and Kevin Wink from Ryerson University’s Geographic Analysis program.
References
Avaling, N. (2009, January 8). Area now being called University Heights, but some call change a rejection of how far we’ve come. Toronto Star, p. A10.
City of Toronto. (n.d.). Open Data Policy. Retrieved from http://www1.toronto.ca/wps/portal/contentonly?vgnextoid=7e27e03bb8d1e310VgnVCM10000071d60f89RCRD
DiManno, R. (2013, July 6). Ford fest makes a strategic move. Toronto Star, p. A2.
Jetzek, T., Avital, M. & Bjorn-Andersen, N. (2014). Data-driven innovation through open government data. Journal of Theoretical and Applied Electronic Commerce Research, 9(2), 100-120.
Fraser, D. (2015, May 1). Ontario announces more open data, public input. St. Catharines Standard. Retrieved from http://www.stcatharinesstandard.ca/2015/05/01/ontario-announces-more-open-data-public-input
Kucera, J. (2015). Open government data publication methodology. Journal of Systems Integration, 6(2), 52-61.
Lindgren, A. (2009). News, geography and disadvantage: Mapping newspaper coverage of high-needs neighbourhoods in Toronto, Canada. Canadian Journal of Urban Research, 18(1), 74-97.
Lindgren, A. & Wong, C. (2012). Want to understand local news? Make a map. 2012 Journalism Interest Group proceedings. Paper presented at Congress 2012 of the Humanities and Social Sciences conference. Retrieved from http://cca.kingsjournalism.com/?p=169
Maloney, P. (2007, January 16). Mayor sticks up for Scarborough. Toronto Star. Retrieved from http://www.thestar.com/news/2007/01/16/mayor_sticks_up_for_scarborough.html?referrer=
Pellettier, A., Brawley, D. & Yuen, S. (2013, July 11). Don’t call us Scarberia [Letter to the editor]. Toronto Star. Retrieved from http://www.thestar.com/opinion/letters_to_the_editors/2013/07/11/dont_call_us_scarberia.html
Riffe, D., Aust, C. F. & Lacy, S. R. (1993). The effectiveness of random, consecutive day and constructed week sampling. Journalism Quarterly, 70, 133-139.
Schoenhoff, S. & Tribe, L. (2014). Canada continues to struggle in Newspapers Canada’s annual FOI audit [web log post]. Retrieved from https://cjfe.org/blog/canada-continues-struggle-newspapers-canada%E2%80%99s-annual-foi-audit
Standing Committee on Government Operations and Estimates. (2014). Open data: The way of the future: Report of the Standing Committee on Government Operations and Estimates. Retrieved from http://www.parl.gc.ca/content/hoc/Committee/412/OGGO/Reports/RP6670517/oggorp05/oggorp05-e.pdf
Zuiderwijk, A., Janssen, M. & Davis, C. (2014). Innovation with open data: Essential elements of open data ecosystems. Information Polity, 19(1, 2), 17-33.

This week’s Geothoughts podcast examines how spatial data can be used to improve access to healthcare for all Canadians.
By Drew Bush
We’re very excited to present you with our fifth episode of Geothoughts. You can also subscribe to this Podcast by finding it on iTunes.
This episode features a look at how spatial data can be used to improve access to healthcare for all Canadians. In it we talk with Scott Bell from the Department of Geography and Planning at University of Saskatchewan.
Thanks for tuning in. And we hope you subscribe with us at Geothoughts on iTunes. A transcript of this original audio podcast follows.
TRANSCRIPT OF AUDIO PODCAST
This week we sit down with Professor Scott Bell from the Department of Geography and Planning at University of Saskatchewan to discuss his research using geospatial data to help create better healthcare access for all Canadians.
[Geothink.ca theme music]
Welcome to Geothoughts. I’m Drew Bush.
“From a GIS, GIScience perspective, I sort of went extreme in the access to location, or the location aspects of access. So looking at the arrangements of doctors just to get a sense of, just at the physical level, is there an equitable arrangement of doctors. And we know pretty clearly that that’s not true across Canada, at different scales and at the scale of the nation.”
To draw this conclusion, Bell brings a Geographic Information Systems (GIS) perspective to the context of a broad variety of areas of interest in human health. For example, he has collaborated on interdisciplinary health, environmental, and social science research that uses both public and private data.
“My interest in health really has broadened areas of interest to look at access to a variety of things that effect our health.”
This year alone he has worked with the University of Saskatchewan’s College of Dentistry and also examined the accessibility of Canadian food in terms of finding healthy eating options. But collecting such data can sometimes be onerous work owing to the fact that different provincial colleges of physicians and surgeons have varying standards for their data, he must collect population data from Statistics Canada for comparison, and sometimes he might even collect his own data using surveys to gain insight.
“So we integrate data across a variety of sources, mostly publicly available not always in the sort of true and honest definition of open data…We collect our own sometimes using telephone surveys of people to get an idea of what’s controlling or what’s affecting their access to healthcare.”
What’s important is figuring out what particular issues might impact how people access doctors. These include aspects of a given doctor’s services, such as the number of patients they take, or the personal concerns of the consumer or patient.
“We as just members of the public when we look for a doctor, access can be affected by our own personal opinions, or beliefs, or worldviews, or preferences. So if I prefer to be seen by a male doctor and my neighborhood is filled with female doctors, a physical measure of access might show that there are lots of doctors near me and I should have great accessibility. But I’m not willing to see any of those doctors.”
[Geothink.ca theme music]
[Voice over: Geothoughts are brought to you by Geothink.ca and generous funding from Canada’s Social Sciences and Humanities Research Council.]
###
If you have thoughts or questions about this podcast, get in touch with Drew Bush, Geothink’s digital journalist, at drew.bush@mail.mcgill.ca.
By Drew Bush
Scott Bell is a professor in the Department of Geography and Planning at the University of Saskatchewan.
If you ask a Canadian what makes them most proud of their country, free and easily accessible healthcare would often be near the top of the list. But for one Geothink researcher, this commonly held narrative has been disproven and led him to help those in need of better healthcare.
“People in the north and some rural areas just don’t have that many doctors per person or have very low rates of doctors per 1,000 people,” Scott Bell, a professor of Geography and Planning at University of Saskatchewan, said. “And I think one of the things that really captured my interest here is that as Canadians and in Canada, we sort of expect equitable healthcare. And I think a lot of people—who have easy access to healthcare, are happy with their doctor’s care, and their ability to make appointments, and things like that—don’t think too much about the fact that not all Canadians have access to the free healthcare services we should all have access to. So that’s kind of a guiding principle.”
To draw the above conclusions, Bell brings a Geographic Information Systems (GIS) perspective to examine a broad variety of areas in human health. For example, he has collaborated on interdisciplinary health, environmental, and social science research that uses both public and private data including from surveys he has conducted himself and data he’s collected from provincial colleges of physicians and surgeons.
To get a sense of which populations are being served or not served by healthcare, his research compares the above data against population data from Statistics Canada (particularly, he says, the 2006 Long Form Census). This year he has worked with the University of Saskatchewan’s College of Dentistry and also examined the accessibility of Canadian food in terms of finding healthy eating options.
“My interest in health research really is focused on disparities in accessibility, and accessibility is a word that people use in day-to-day conversations a lot,” he told Geothink. “In terms of health, it’s a pretty complicated concept that is related not just to services themselves, where and when they’re available, when a clinic might be open, and how many doctors are there, and how many bookings they can take, or have open for drop-in or scheduling. But is also related to the patients themselves.”
It’s these consumer issues that can complicate how healthcare services can be made more accessible.
“Access can be affected by our own personal opinions, or beliefs, or worldviews, or preferences,” he said. “So if I prefer to be seen by a male doctor and my neighborhood is filled with female doctors, the physical measure of access might show that there are lots of doctors near me and I should have great accessibility. But I’m not willing to see any of those doctors.”
He has also found that when GIS is used to look at extreme situations in specific locations in Canada by just the arrangement of doctors, it’s not true that everyone has access to healthcare across the country. But identifying such a problem by locating those most in need often is the first step in starting a conversation to correct such problems.
If you have thoughts or questions about this article, get in touch with Drew Bush, Geothink’s digital journalist, at drew.bush@mail.mcgill.ca.

Jon Corbett is an associate professor in the University of British Columbia’s Community, Culture and Global Studies program and co-director of the Centre for Social, Spatial and Economic Justice.
By Drew Bush
In our daily usage, most maps contain a logical representation of a city’s streets or a forest’s hiking trails that allows us to safely navigate to new locations. For many indigenous and excluded populations, maps can play a more fundamental role.
Jon Corbett, an Associate Professor in Community, Culture and Global Studies at the University of British Columbia, has spent decades investigating how cartographic processes and tools used by local communities help express their relationships to and knowledge of land and resources. Corbett has worked in Australia, Indonesia, the Philippines, and in British Columbia with several First Nations communities.
“Often maps, although they are powerful tools, they don’t tell the full story because a lot of indigenous knowledge and a lot of local knowledge is tied up in storytelling, and histories, and is built around specific landmarks within a particular town within a particular place,” he told Geothink last June.
To better capture this relationship with the land, Corbett and his graduate student Nicholas Blackwell first began building their Geolive platform in 2008. Geolive is an online interactive mapping interface based on the Google Maps API that allows administrators to create public maps and place user-generated information on those maps while users can add content and communicate.
In other words, users of this platform can add attributes to specific locations on the map using text, photos, video or other media to show how specific places get used by the community. As the platform has gotten more sophisticated, users have gained the ability to moderate each other, filter info with key words, and use mobile devices to contribute short videos or photos.
The most important element is that users take ownership of the place they live and contribute important local knowledge. Corbett got his start doing this type of work before programs such as Google Earth existed. In fact, he literally used sticks, sand and stones when he began thinking about how to empower often excluded communities with maps during his Ph.D. research in Borneo.
“I am really interested in how maps can become transformative agents in change, particularly social change,” he said. “So my research in the past has involved working with a lot of excluded populations, often indigenous population in different places in the world. Looking at how mapping can become a tool to express a different relationship, or a different set of experiences, or a different set of stories as it relates to that particular group and the land on which they live.”
His work has evolved from using sketch mapping where participants draw rivers, streets, and watershed boundaries from memory to scale mapping where they add or fill in locally-based information on scale maps or three-dimensional modelling where participants build a physical, tactile terrain map. Of the digital, he comments that some elements can be lost from a process that once involved using what was on the ground.
“There is this funny thing that occurs as you move from more tactile, more tangible forms of participation mapping into the digital world,” he said after enumerating the many advantages of digital mapping with communities. “In a sense, your own relationship to those types of projects diminishes as you become more virtual.”
If you have thoughts or questions about this article, get in touch with Drew Bush, Geothink’s digital journalist, at drew.bush@mail.mcgill.ca.
![]()
Hello everyone,
We are putting together a draft prospectus for consideration by the University of Ottawa Press for their Law, Technology and Media book series. The edited volume will focus on the legal, policy, regulatory, and ethical issues arising from the geoweb. Anticipated issues that the volume will cover include privacy, surveillance, IP, licensing, open data, the public/private divide, citizen engagement, and governance.
We seek brief expressions of interest for chapters. Please send to both Elizabeth and Leslie, by August 30, a chapter title and a short (150-200 word) abstract for our consideration.
Thank you,
Leslie and Elizabeth