Tag Archives: Scott Bell

Geothink at the Spatial Knowledge and Information Canada conference

By Suthee Sangiambut

This past February, we had the pleasure of viewing new research from Geothink academics and students at the Spatial Knowledge and Information (SKI) Canada conference in Banff, Alberta. This two-day conference is special as it addresses a variety of issues ranging from Geographic Information Systems (GIS) techniques and tool-building to applied spatial statistics, particularly in the context of Canadian social issues.

Geothink Head, Dr. Renee Sieber, delivered the keynote address. She spoke on the “10 Things You Should Know About Engagement, Volunteerism, and Participation in Geospatial Technologies” and gave insights on how social theory and geospatial technologies coexist. She cautioned against treating technology as a black box and taking technical tools for granted, particularly if we do not completely understand them. Application of technology does not necessarily result in more or better participation. This is one of the potential issues of the drive towards data-driven decision making, particularly if we dispense with processes of democratic participation.

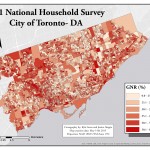
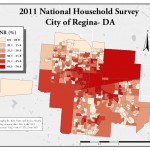
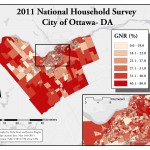
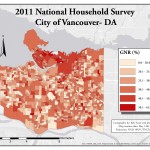
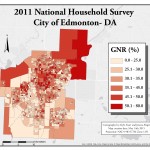
This year, Geothink co-applicant Dr. Scott Bell (University of Saskatchewan) presented findings on Local patterns of national household survey non-response in Canadian cities. He highlighted methodological issues with government collection of census data, such as the Global Non-response Rate (GNR) variable. Some cities which are very small but with a high GNR can be excluded from the final results due to issues of spatial autocorrelation and edge effects. City growth is also problematic for normalising census data to make comparisons, particularly when different divisions grow at different rates. Dr. Bell’s research team developed a variety of models to predict non-response and found correlations of non-response rates with other social variables such as whether the respondent was a renter or aboriginal in origin.

Geothink student Lauren Arnold (University of British Columbia Okanagan) spoke of The Potential Role of Open Data for Public Engagement in Environmental Assessment. Environmental assessments are highly dependent on spatial analysis and require datasets at very large spatial and temporal scales to calculate and predict cumulative effects of actions for the environment, society, and economy. Open data has the potential to address issues of public participation in environmental assessments and bring in more citizen involvement, improve transparency, and potentially even decision-making. Contextualising open data within Public Participation GIS (PPGIS), Arnold argued that open data can be another catalyst for integration of PPGIS into public consultation and decision-making processes.

Suthee Sangiambut (McGill University) presented an alternative view of his Master’s research findings. Looking at open data flow in civic apps, he noted that data undergoes transformations within government, at the developer, and in between. Data transformations are often done outside of government by data re-users, but the choices government makes in how it collects or distributes data will affect data reuse down the line. He also demonstrated that open data consumed through apps are not an exact one-to-one representation of data used in government and users should be aware that open data still represents a curation of sorts.

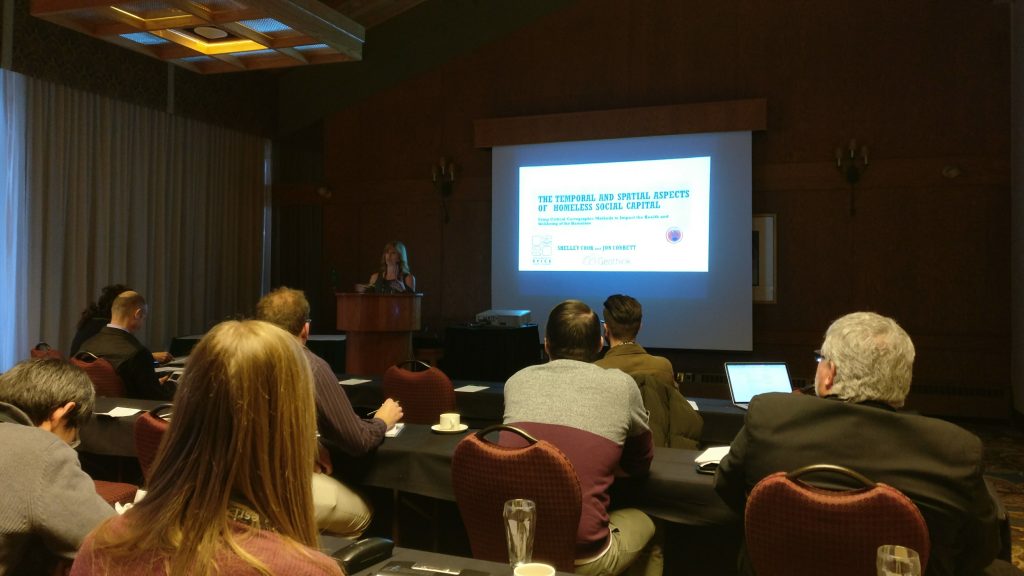
Shelley Cook (University of British Columbia Okanagan) won joint first prize for student presentations. She presented on The Temporal and Spatial Aspects of Homeless Social Capital and gave an in-depth look at how homeless is controlled by legislative and spatial tools, such as ‘red zones’, in Kelowna, BC. She found that the size of a homeless person’s geographic footprint (their coverage of the city) is related to their social capital; smaller activity spaces allow for less social capital. Homeless geographic footprint is also inversely related to dependency on services. However, once the homeless are provided housing, their geographic footprint shrinks.

Finally, Brennan Field (University of Saskatchewan) presented on Policy Mobility of Police Interactions Open-Data. Such policies cover data collected on police interactions with the public such as vehicle stops and fines. His research will look at how these data policies are spread across jurisdictions and departments, and how they are translated to the operational level.

This 5-9 April 2017, Geothinkers will be at the American Association of Geographers (AAG) annual meeting in Boston. For a list of presentations and panels to attend, see the programme guide here. We will be tweeting for the duration of the conference on Twitter (@geothinkca).

Geothink at the 2016 Annual Meeting of the American Association of Geographers

By Drew Bush

From March 29 to April 2, 2016, Geothink’s students, co-applicants, and collaborators presented their research and met with colleagues at the now concluded 2016 Association of American Geographers (AAG) Annual Meeting in San Francisco, CA. Over the week, Geothinkers gave 11 presentations, organized six sessions, chaired five sessions, and were panellists on four sessions. See who attended here.

“This year’s AAG provided a great opportunity to get geographically diverse Geothinkers together,” Victoria Fast, a recently graduated doctoral student in Ryerson University’s Department of Geography and Environmental Studies, wrote in an e-mail to Geothink.ca. “I can’t think of a better place for a meeting about a special journal issue on open data; there are so many fresh, uncensored ideas flying around the conference, both inside and outside of sessions.”

Of particular note for Fast was Panel Session 1475 Gender & GIScience (see her Geothink.ca guest post here). Panelists in the session included Geothink Head Renee Sieber, associate professor in McGill University’s Department of Geography and School of Environment; And, Geothink collaborator Sarah Elwood, a professor in University of Washington’s Department of Geography.

Others agreed.

“A panel on gender and GIScience was refreshing and enlightening,” Geothink Co-Applicant Scott Bell, a professor of Geography and Planning at University of Saskatchewan, wrote to Geothink.ca.

“My presentation was in a day long symposium on human dynamism,” he added. “It summarized a recently published Geothink aligned paper on human mobility tracking and active transportation (published in the International Journal of Geographical Information Science). It seemed to go over pretty well, I’m glad I was in the day-long event as the room was packed most of the day.”

For others, the high cost of the location meant they couldn’t stay for a full week or attend every single session. Still they reported good turnout by members of the Geothink team.

“This year we did not organize a specific panel or panels, or specific sessions to showcase Geothink work,” wrote Geothink Co-Applicant Teresa Scassa, Canada Research Chair in Information Law and professor in the Faculty of Law at the University of Ottawa. “This meant that our presentations were dispersed across a variety of different sessions, on different days of the week.”

Many Geothinkers were also intimately involved in running parts of the conference.

“This was a standout AAG for me,” wrote Geothink researcher Alexander Aylett, a professor and researcher at the Institut national de la recherche scientifique, who ran three sessions (Find an overview of what Aylette’s sessions did at www.smartgreencities.org). In collaboration with Andrés Lluque-Ayla from Durham University we ran a full day of sessions on the overlap between “Smart” and “Sustainable” cities.   We had some excellent presentations—including one from fellow Geothinker Pamela Robinson—and a strong turn out throughout the whole day. (Even at 8 AM, which was a shock to me!).”

For some students, it was the first time they had attended the meeting or presented their own research.

“This was my first time at the AAG,” said Geothink Newsletter Editor, Suthee Sangiambut, a maser’s student in McGill University’s Department of Geography with Sieber. “I was quite excited to be at the event and was able to meet all kinds of geographers, all of whom had different ideas on what geography exactly is.”

“It was great to see how global events of the past years were shaping our discussions on the Geoweb, privacy, surveillance, national identity, immigration, and more,” he added. “Those at the Disrupt Geo session were able to hear perspectives from private sector and civil society sides, which was quite refreshing and is something I would like to see more of in the future.”

The AAG annual meeting has been held every year since the association’s founding in 1904. This year’s conference included more than 9,000 attendees.

If you have thoughts or questions about this article, get in touch with Drew Bush, Geothink’s digital journalist, at drew.bush@mail.mcgill.ca. We also want to thank Victoria Fast for her willingness to share photos from the 2016 AAG Annual Meeting.

Please find an abstract for the presentation mentioned in this article below.

Leveraging Sensor Networks to Study Human Spatial Behavior

Abstract:
In the past decade society has entered a technological period characterized by mobile and smart computing that supports input and processing from users, services, and numerous sensors. The smartphones that most of us carry in our pockets offer the ability to integrate input from sensors monitoring various external and internal sources (e.g., accelerometer, magnetometer, microphone, GPS, wireless internet, Bluetooth). These relatively raw inputs are processed on the phones to provide us with a seemingly unlimited number of applications. Furthermore, these raw inputs can be integrated and processed in ways that can offer novel representations of human behavior, both dissagregate and aggregate. As a result, new opportunities to examine and better understand human spatial behaviour are available. An application we report here involved monitoring of a group of people over an extended period of time. Monitoring is timed at relatively tightly spaced intervals (every 2 minutes). Such a research setting lends itself to both planned and natural experiments; the later of which emerge as a result of the regular and on going nature of data collection. We will report on both a natural experiment  and planned observations resulting from 3 separate implementations of our smartphone based observations. The natural experiment that emerged in the context of our most recent month-long monitoring study of 28 participants using mobile phone-based ubiquitous sensor monitoring will be our focus, but will be contextualized with related patterns from earlier studies. The implications for public health and transportation planning are discussed.

Moving Forward with Canadian Census Data

By Naomi Bloch


Chloropleth maps of National Household Survey global non-response data at the dissemination-area level courtesy Scott Bell. Global non-response rates > 50% resulted in suppression of data for that spatial unit. All maps are classified using a quantile classification scheme.


As we move forward (and backward) with the 2016 return of Canada’s long-form census, questions remain for everyone who uses Statistics Canada’s key socio-economic data. Researchers, local government agencies, community organizations, and industry will still need to use data collected via the 2011 National Household Survey and understand how to reconcile that information with long-form census data.

Concerns regarding the reliability of NHS data stem from the lower response rates that resulted from the non-mandatory nature of the 2011 survey. The overall response rate for the survey decreased from 94 percent in 2006 to 69 percent in 2011. Media attention has centred on the fact that Statistics Canada chose not to release survey data for 25 percent of all census subdivisions because response rates for those spatial units were too low. A key question is whether the regions for which we have no reliable data share certain socio-economic characteristics — and if so, how this might impact service provision.

Geothink co-applicant researcher Scott Bell, a professor of Geography and Planning at University of Saskatchewan, has been studying and mapping the spatial patterns of the National Household Survey’s global non-response rates. His work examines various geographic levels, and considers response rate patterns relative to several socio-economic variables. Bell found that across the 15 cities he studied, there are many commonalities between areas where response rates are similar.

In this video interview, Bell discusses his research and its implications.

For more from Scott Bell, see also: The Long-term Impacts of the Short-Lived National Household Survey

If you have thoughts or questions about this video interview, get in touch with Naomi Bloch, Geothink’s digital journalist, at naomi.bloch2@gmail.com.

The Long-term Impacts of the Short-lived National Household Survey

Tweet

By Naomi Bloch

On November 5, Navdeep Bains, Canada’s new Minister of Innovation, Science and Economic Development (now that’s a mouthful!) confirmed the rumours that the country’s mandatory long-form census will be reinstated in 2016.

But what are the long-term consequences of the interruption in mandatory data collection caused by 2011’s National Household Survey (NHS)? How significant is this short-lived census change likely to be?

Geothink co-applicant researcher Scott Bell, a professor of Geography and Planning at University of Saskatchewan, has been studying and mapping the spatial patterns of the voluntary National Household Survey data, comparing global non-response rates in metropolitan and non-metropolitan areas across the country. After today’s official announcement, Bell shared a few preliminary thoughts based on his research.

profile photo of Scott Bell

Scott Bell is a professor in the Department of Geography and Planning at the University of Saskatchewan.

Geothink: Now that the mandatory long-form census has been re-instated, is there anything that researchers or others who rely on location-based specifics from census data need to keep mind?

Scott Bell: In my own research I have been relying on 2006 data for much longer than I would have if the 2011 survey had been the long form of the census. The NHS misrepresents different parts (and types of parts) of the country. In my analysis of 15 Canadian cities, there were lower response rates (measured by non-response) in places with low income, aboriginal populations, new immigrants, and lower rates of education. This is quite troubling since the only solution Stats Canada had at their disposal was over sampling in such areas, which might exacerbate the bias.

Geothink: Did you find that your own recent research was impacted by the 2011 data, and are there likely to be any long-term implications for researchers, given that just one survey period was affected?

Scott Bell: Yes, I was compelled to use long-form data from 2006. It is a relief that we will have a return of this data for 2016. I have always appreciated Canada’s five-year census cycle and a 10-year wait is going to be OK, this once. But there will be a persistent problem trying to understand our society between 2011 and 2016 that won’t be true of another five-year period. Our understanding of economics, household mobility, finances, and structure, immigration, education, etc. for the period from 2011 to 2016 is diminished.

Geothink: Are there any important considerations to keep in mind, for those integrating data from 2011 and other periods?

Scott Bell: In work I hope to publish in the next six months, patterns of response (actually non-response) and what social and economic variables predict this non-response will be elucidated. The next step might be the development of tools to adjust NHS values in order to make the data collected more reliable. The most important step in this direction will be the collection of the long form in 2016; that data will be useful in establishing estimates of what 2011 values are valid and perhaps allow for the setting of “correction factors” for egregious rates of non-response.

Stay tuned for more detailed insights from Scott Bell on location-specific considerations of the National Household Survey data, coming soon to Geothink.ca.

If you have thoughts or questions about this article, get in touch with Naomi Bloch, Geothink’s digital journalist, at naomi.bloch2@gmail.com.

Geothink Video Interview 3: Our Experts Take on Crowdsourcing

Screen Shot 2016-02-24 at 8.34.20 PMBy Drew Bush

We’re excited to bring you our long-awaited video interview that features Geothink’s experts discussing issues of authenticity and accuracy with crowdsourced data.  Data collected through crowdsourcing methods increasingly has replaced traditional forms of data collection.

This video features Geothink Head Renee Sieber, associate professor in McGill University’s Department of Geography and School of Environment; Daren Brabham, assistant professor in the University of Southern California Annenberg School of Journalistm and Communication; Scott Bell, a professor of Geography and Planning at University of Saskatchewan; And, Claus Rinner,a professor and chair of Ryerson University’s Department of Geography and Environmental Studies.

We hope you enjoy this video as much as we enjoyed making it. Afterwards, leave us a comment and tell us what you think about this important area of debate concerning crowdsourced data.

You can also learn more about crowdsourcing by reading our post on this central topic to our 2015 Summer Institute, listening to these lectures from the Summer Institute, or listening to our experts talk about the topic over lunch last June. 

If you have thoughts or questions about this video, get in touch with Drew Bush, Geothink’s digital journalist, at drew.bush@mail.mcgill.ca.

Geothoughts 5: Helping Bring Equitable Access to Healthcare to All Canadians

This week's Geothoughts podcast examines how spatial data can be used to improve access to healthcare for all Canadians.

This week’s Geothoughts podcast examines how spatial data can be used to improve access to healthcare for all Canadians.

By Drew Bush

We’re very excited to present you with our fifth episode of Geothoughts. You can also subscribe to this Podcast by finding it on iTunes.

This episode features a look at how spatial data can be used to improve access to healthcare for all Canadians. In it we talk with Scott Bell from the Department of Geography and Planning at University of Saskatchewan.

Thanks for tuning in. And we hope you subscribe with us at Geothoughts on iTunes. A transcript of this original audio podcast follows.

TRANSCRIPT OF AUDIO PODCAST

This week we sit down with Professor Scott Bell from the Department of Geography and Planning at University of Saskatchewan to discuss his research using geospatial data to help create better healthcare access for all Canadians.

[Geothink.ca theme music]

Welcome to Geothoughts. I’m Drew Bush.

“From a GIS, GIScience perspective, I sort of went extreme in the access to location, or the location aspects of access. So looking at the arrangements of doctors just to get a sense of, just at the physical level, is there an equitable arrangement of doctors. And we know pretty clearly that that’s not true across Canada, at different scales and at the scale of the nation.”

To draw this conclusion, Bell brings a Geographic Information Systems (GIS) perspective to the context of a broad variety of areas of interest in human health. For example, he has collaborated on interdisciplinary health, environmental, and social science research that uses both public and private data.

“My interest in health really has broadened areas of interest to look at access to a variety of things that effect our health.”

This year alone he has worked with the University of Saskatchewan’s College of Dentistry and also examined the accessibility of Canadian food in terms of finding healthy eating options. But collecting such data can sometimes be onerous work owing to the fact that different provincial colleges of physicians and surgeons have varying standards for their data, he must collect population data from Statistics Canada for comparison, and sometimes he might even collect his own data using surveys to gain insight.

“So we integrate data across a variety of sources, mostly publicly available not always in the sort of true and honest definition of open data…We collect our own sometimes using telephone surveys of people to get an idea of what’s controlling or what’s affecting their access to healthcare.”

What’s important is figuring out what particular issues might impact how people access doctors. These include aspects of a given doctor’s services, such as the number of patients they take, or the personal concerns of the consumer or patient.

“We as just members of the public when we look for a doctor, access can be affected by our own personal opinions, or beliefs, or worldviews, or preferences. So if I prefer to be seen by a male doctor and my neighborhood is filled with female doctors, a physical measure of access might show that there are lots of doctors near me and I should have great accessibility. But I’m not willing to see any of those doctors.”

[Geothink.ca theme music]

[Voice over: Geothoughts are brought to you by Geothink.ca and generous funding from Canada’s Social Sciences and Humanities Research Council.]

###

If you have thoughts or questions about this podcast, get in touch with Drew Bush, Geothink’s digital journalist, at drew.bush@mail.mcgill.ca.

Improving Access to Canadian Healthcare Using Open Data with Scott Bell

By Drew Bush

Scott Bell is a professor in the Department of Geography and Planning at the University of Saskatchewan.

Scott Bell is a professor in the Department of Geography and Planning at the University of Saskatchewan.

If you ask a Canadian what makes them most proud of their country, free and easily accessible healthcare would often be near the top of the list. But for one Geothink researcher, this commonly held narrative has been disproven and led him to help those in need of better healthcare.

“People in the north and some rural areas just don’t have that many doctors per person or have very low rates of doctors per 1,000 people,” Scott Bell, a professor of Geography and Planning at University of Saskatchewan, said. “And I think one of the things that really captured my interest here is that as Canadians and in Canada, we sort of expect equitable healthcare. And I think a lot of people—who have easy access to healthcare, are happy with their doctor’s care, and their ability to make appointments, and things like that—don’t think too much about the fact that not all Canadians have access to the free healthcare services we should all have access to. So that’s kind of a guiding principle.”

To draw the above conclusions, Bell brings a Geographic Information Systems (GIS) perspective to examine a broad variety of areas in human health. For example, he has collaborated on interdisciplinary health, environmental, and social science research that uses both public and private data including from surveys he has conducted himself and data he’s collected from provincial colleges of physicians and surgeons.

To get a sense of which populations are being served or not served by healthcare, his research compares the above data against population data from Statistics Canada (particularly, he says, the 2006 Long Form Census). This year he has worked with the University of Saskatchewan’s College of Dentistry and also examined the accessibility of Canadian food in terms of finding healthy eating options.

“My interest in health research really is focused on disparities in accessibility, and accessibility is a word that people use in day-to-day conversations a lot,” he told Geothink. “In terms of health, it’s a pretty complicated concept that is related not just to services themselves, where and when they’re available, when a clinic might be open, and how many doctors are there, and how many bookings they can take, or have open for drop-in or scheduling. But is also related to the patients themselves.”

It’s these consumer issues that can complicate how healthcare services can be made more accessible.

“Access can be affected by our own personal opinions, or beliefs, or worldviews, or preferences,” he said. “So if I prefer to be seen by a male doctor and my neighborhood is filled with female doctors, the physical measure of access might show that there are lots of doctors near me and I should have great accessibility. But I’m not willing to see any of those doctors.”

He has also found that when GIS is used to look at extreme situations in specific locations in Canada by just the arrangement of doctors, it’s not true that everyone has access to healthcare across the country. But identifying such a problem by locating those most in need often is the first step in starting a conversation to correct such problems.

If you have thoughts or questions about this article, get in touch with Drew Bush, Geothink’s digital journalist, at drew.bush@mail.mcgill.ca.

Studying Public Transport Behavior By Accident: Lessons Learned from A Graduate Class in Computer Science with Scott Bell

Saskatchewan's bus lockout lasted one month (Photo courtesy of wn.com).

Saskatchewan’s bus lockout lasted one month (Photo courtesy of wn.com).

By Drew Bush 

Sometimes the best research grows out of collaboration and study within the confines of a classroom. For Scott Bell, an associate professor of Geography and Planning at the University of Saskatchewan, a graduate class in computer science provided just such an opportunity.

The past few years, Bell has collaborated with a colleague in Saskatchewan’s Department of Computer Science, Kevin Stanley, to teach a research-based class that gives students hands-on experience using an Android application for smartphones to measure human behavior at 2-minute intervals. Specifically, the application uses a phone’s accelerometer, GPS, camera, Bluetooth and other sensors to monitor participants’ movements and behaviors.

Last fall, students in the class wanted to examine health beliefs and constructed a survey to administer to participants before the phones were given out. Unrelated to the class’s planned content, the City of Saskatoon locked out its bus drivers, resulting in a month-long transit lockout. The lockout began two weeks before class started.

“We didn’t know what was going to happen during the shutdown,” Bell said. “But during our design stage we included in our survey a series of questions about how the participants get to work, and all of our participants were students at the [University of Saskatchewan]… Do they prefer to take public transit? Are they regular transit users? That kind of thing.”

Afterwards, Bell’s class gave these participants the phones and tracked them for a month—with the lockout ending two weeks into this period. Bell and Stanley’s students could then look at how student movement patterns and behaviors changed during and after a time period in which public transport was unavailable.

“It was interesting,” Bell said. “And one of the main findings, was that there wasn’t a change in attendance. So when the strike, when the lockout was on, everybody was still coming to the university at about the same rate as they came after the lockout ended, so when transit was fully available again.”

However, Bell and Stanley’s students noticed that when the lockout ended student trips to and from school actually became quite a bit shorter. They hypothesized that when their participants were forced to find alternate means of transportation they often relied on friends with private vehicles or on their own car.

This new reliance on private vehicles made additional trips, like running errands, possible on the way home thanks to the flexibility they allow compared to public transit. While not yet confirmed in this research, Bell calls this type of behavior “trip-chaining,” an idea often mentioned in transportation geography. Once the lockout ended and these participants returned to public transport, such behavior ended.

“We did learn in this study that we could use this technique to study transit behavior and we’re thinking a little bit more about that,” Bell said. “About how we can maybe do that with some of the Geothink partners that have more open data policies regarding their transit data and transit use.”

If Bell and Stanley’s students had only examined student attendance rates and arrival times at University of Saskatchewan, then they might have concluded the lockout had little affect on student behavior. However, by using surveys and smartphones, this technique established how stressful it was for students and, perhaps most importantly, how behaviors actually changed on the ground.

If you have thoughts or questions about this article, get in touch with Drew Bush, Geothink’s digital journalist, at drew.bush@mail.mcgill.ca.