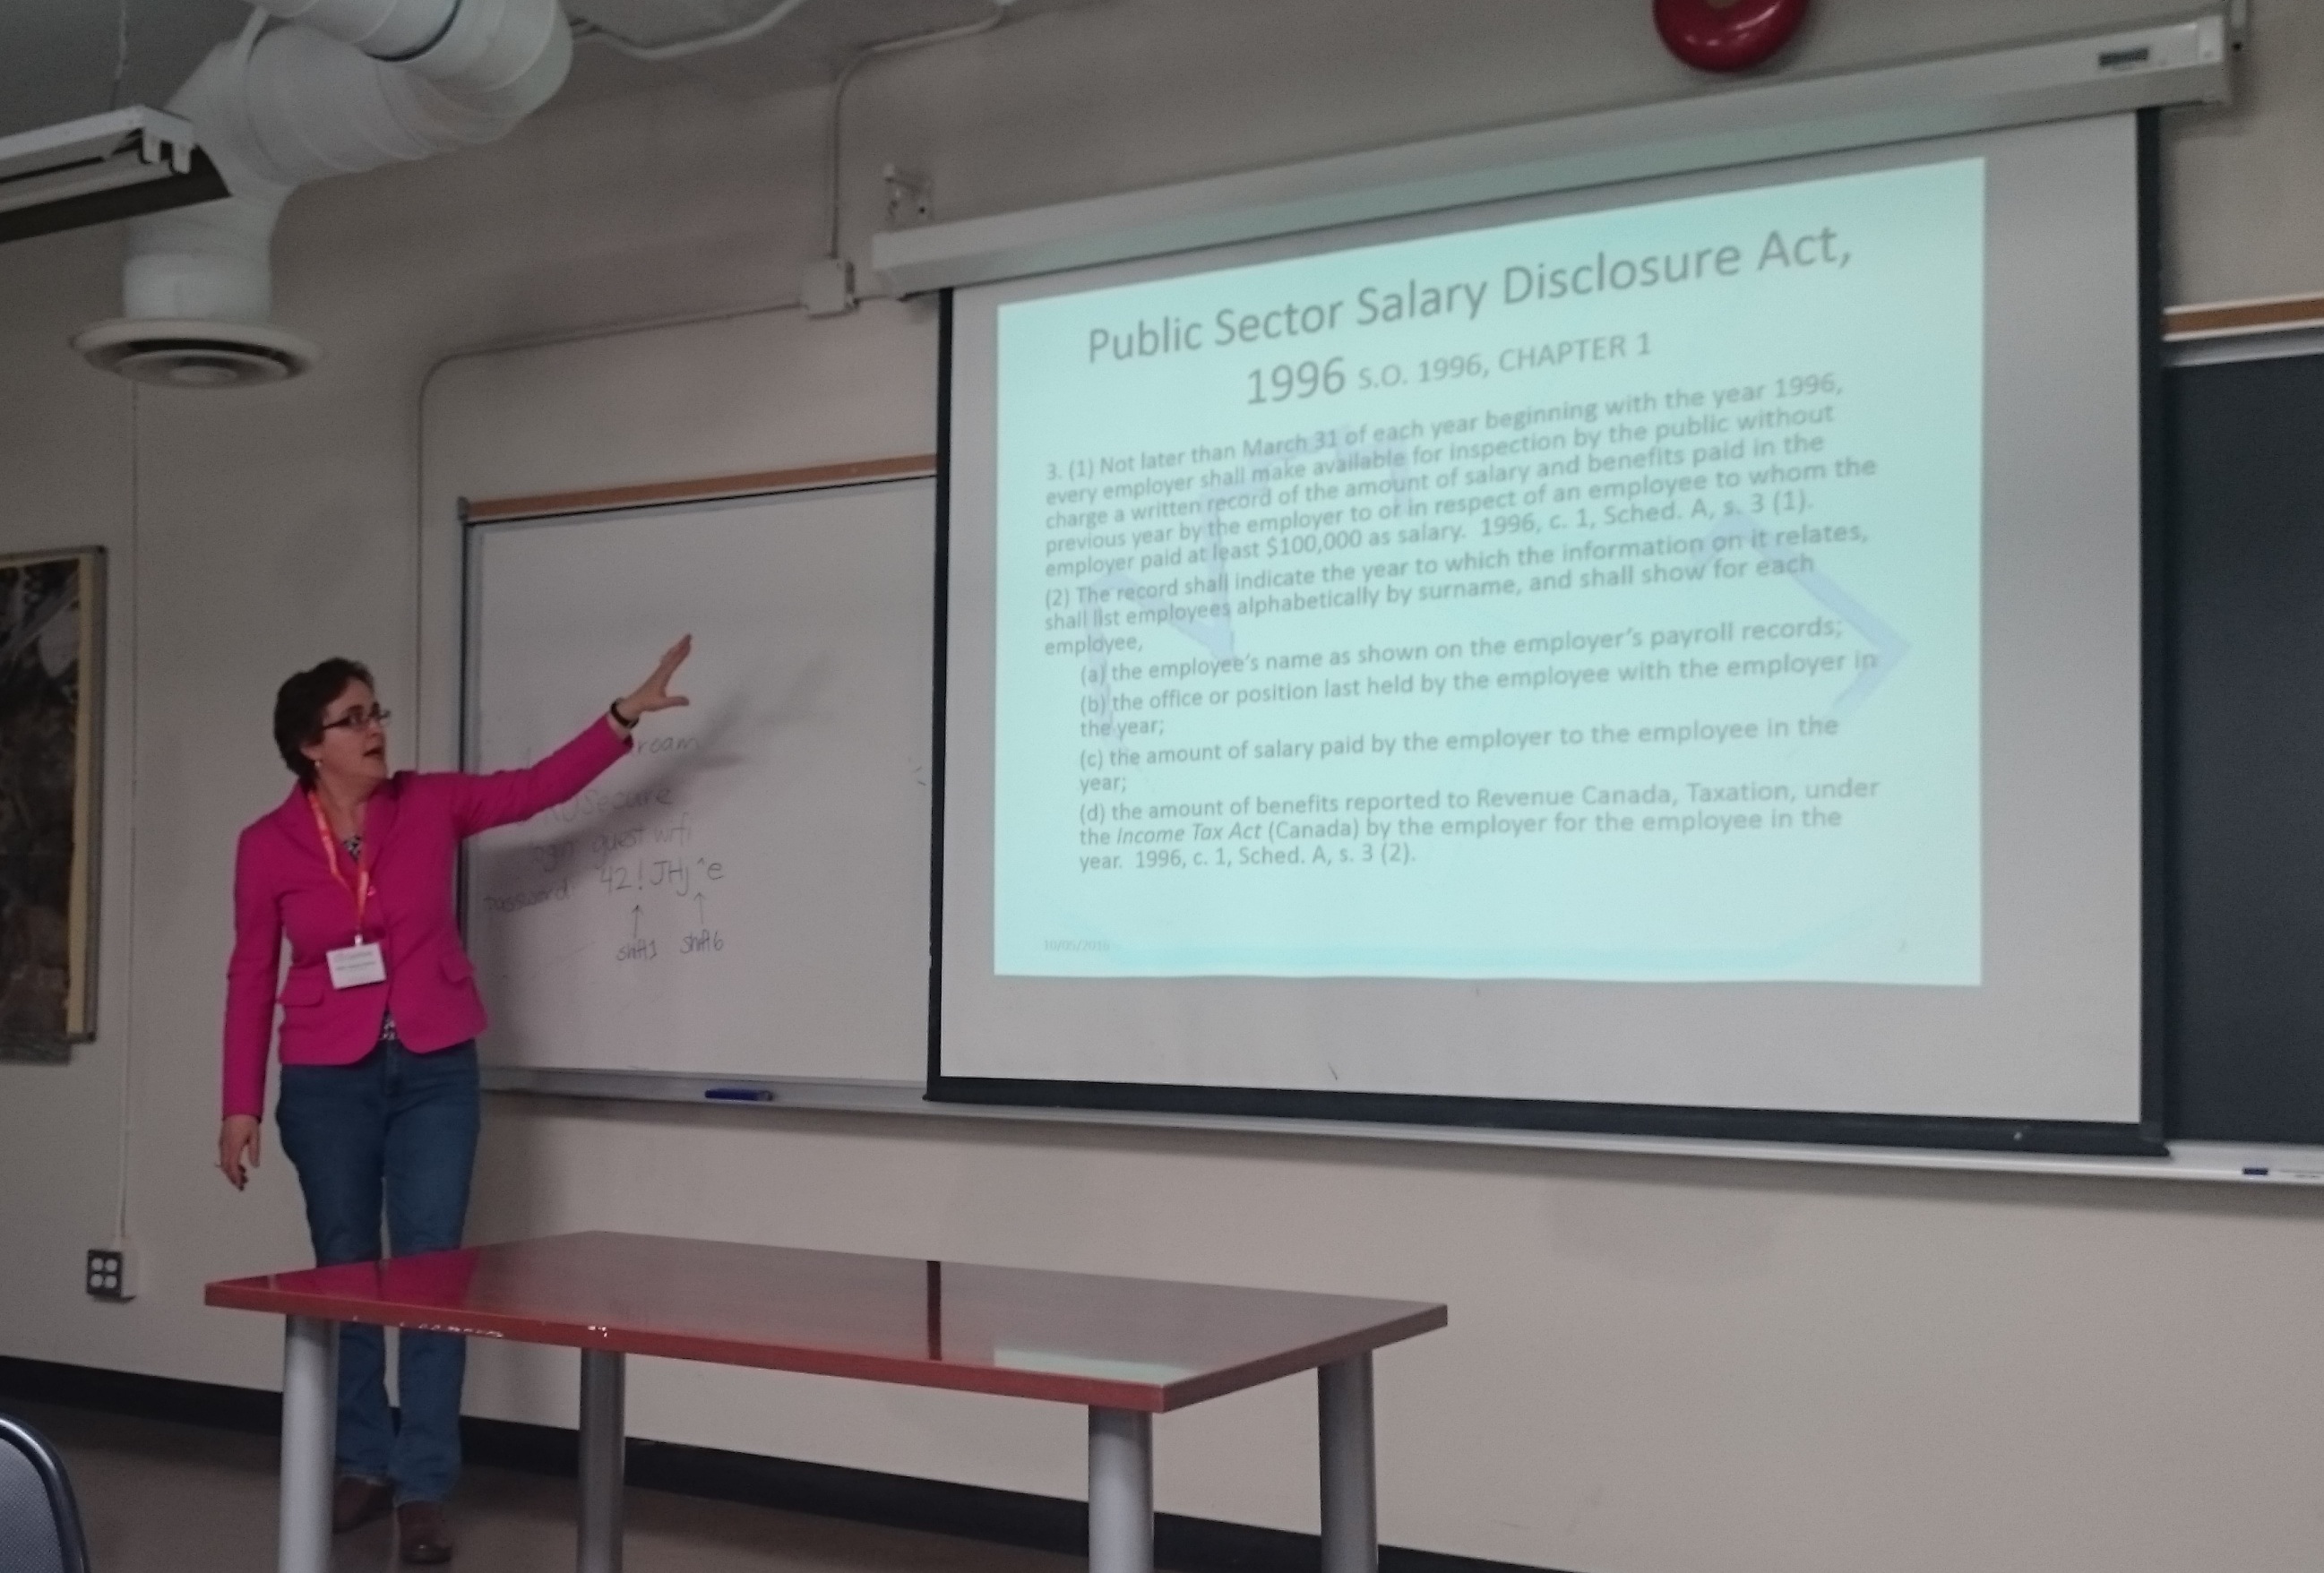
Day two of Geothink’s 2016 Summer Institute began with short lectures on specific disciplinary perspectives on open data. Teresa Scassa, Canada Research Chair in Information Law at the University of Ottawa, gave a legal perspective on the value of open data.
By Drew Bush
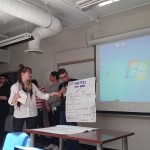
Day two of the 2016 Summer Institute began with presentations from Geothink’s faculty that aimed to provide different disciplinary approaches to evaluating open data. Armed with this information, students spent the rest of the day working in groups to first create measures to value open data, and, second, role-play how differing sectors might use a specific type of data.
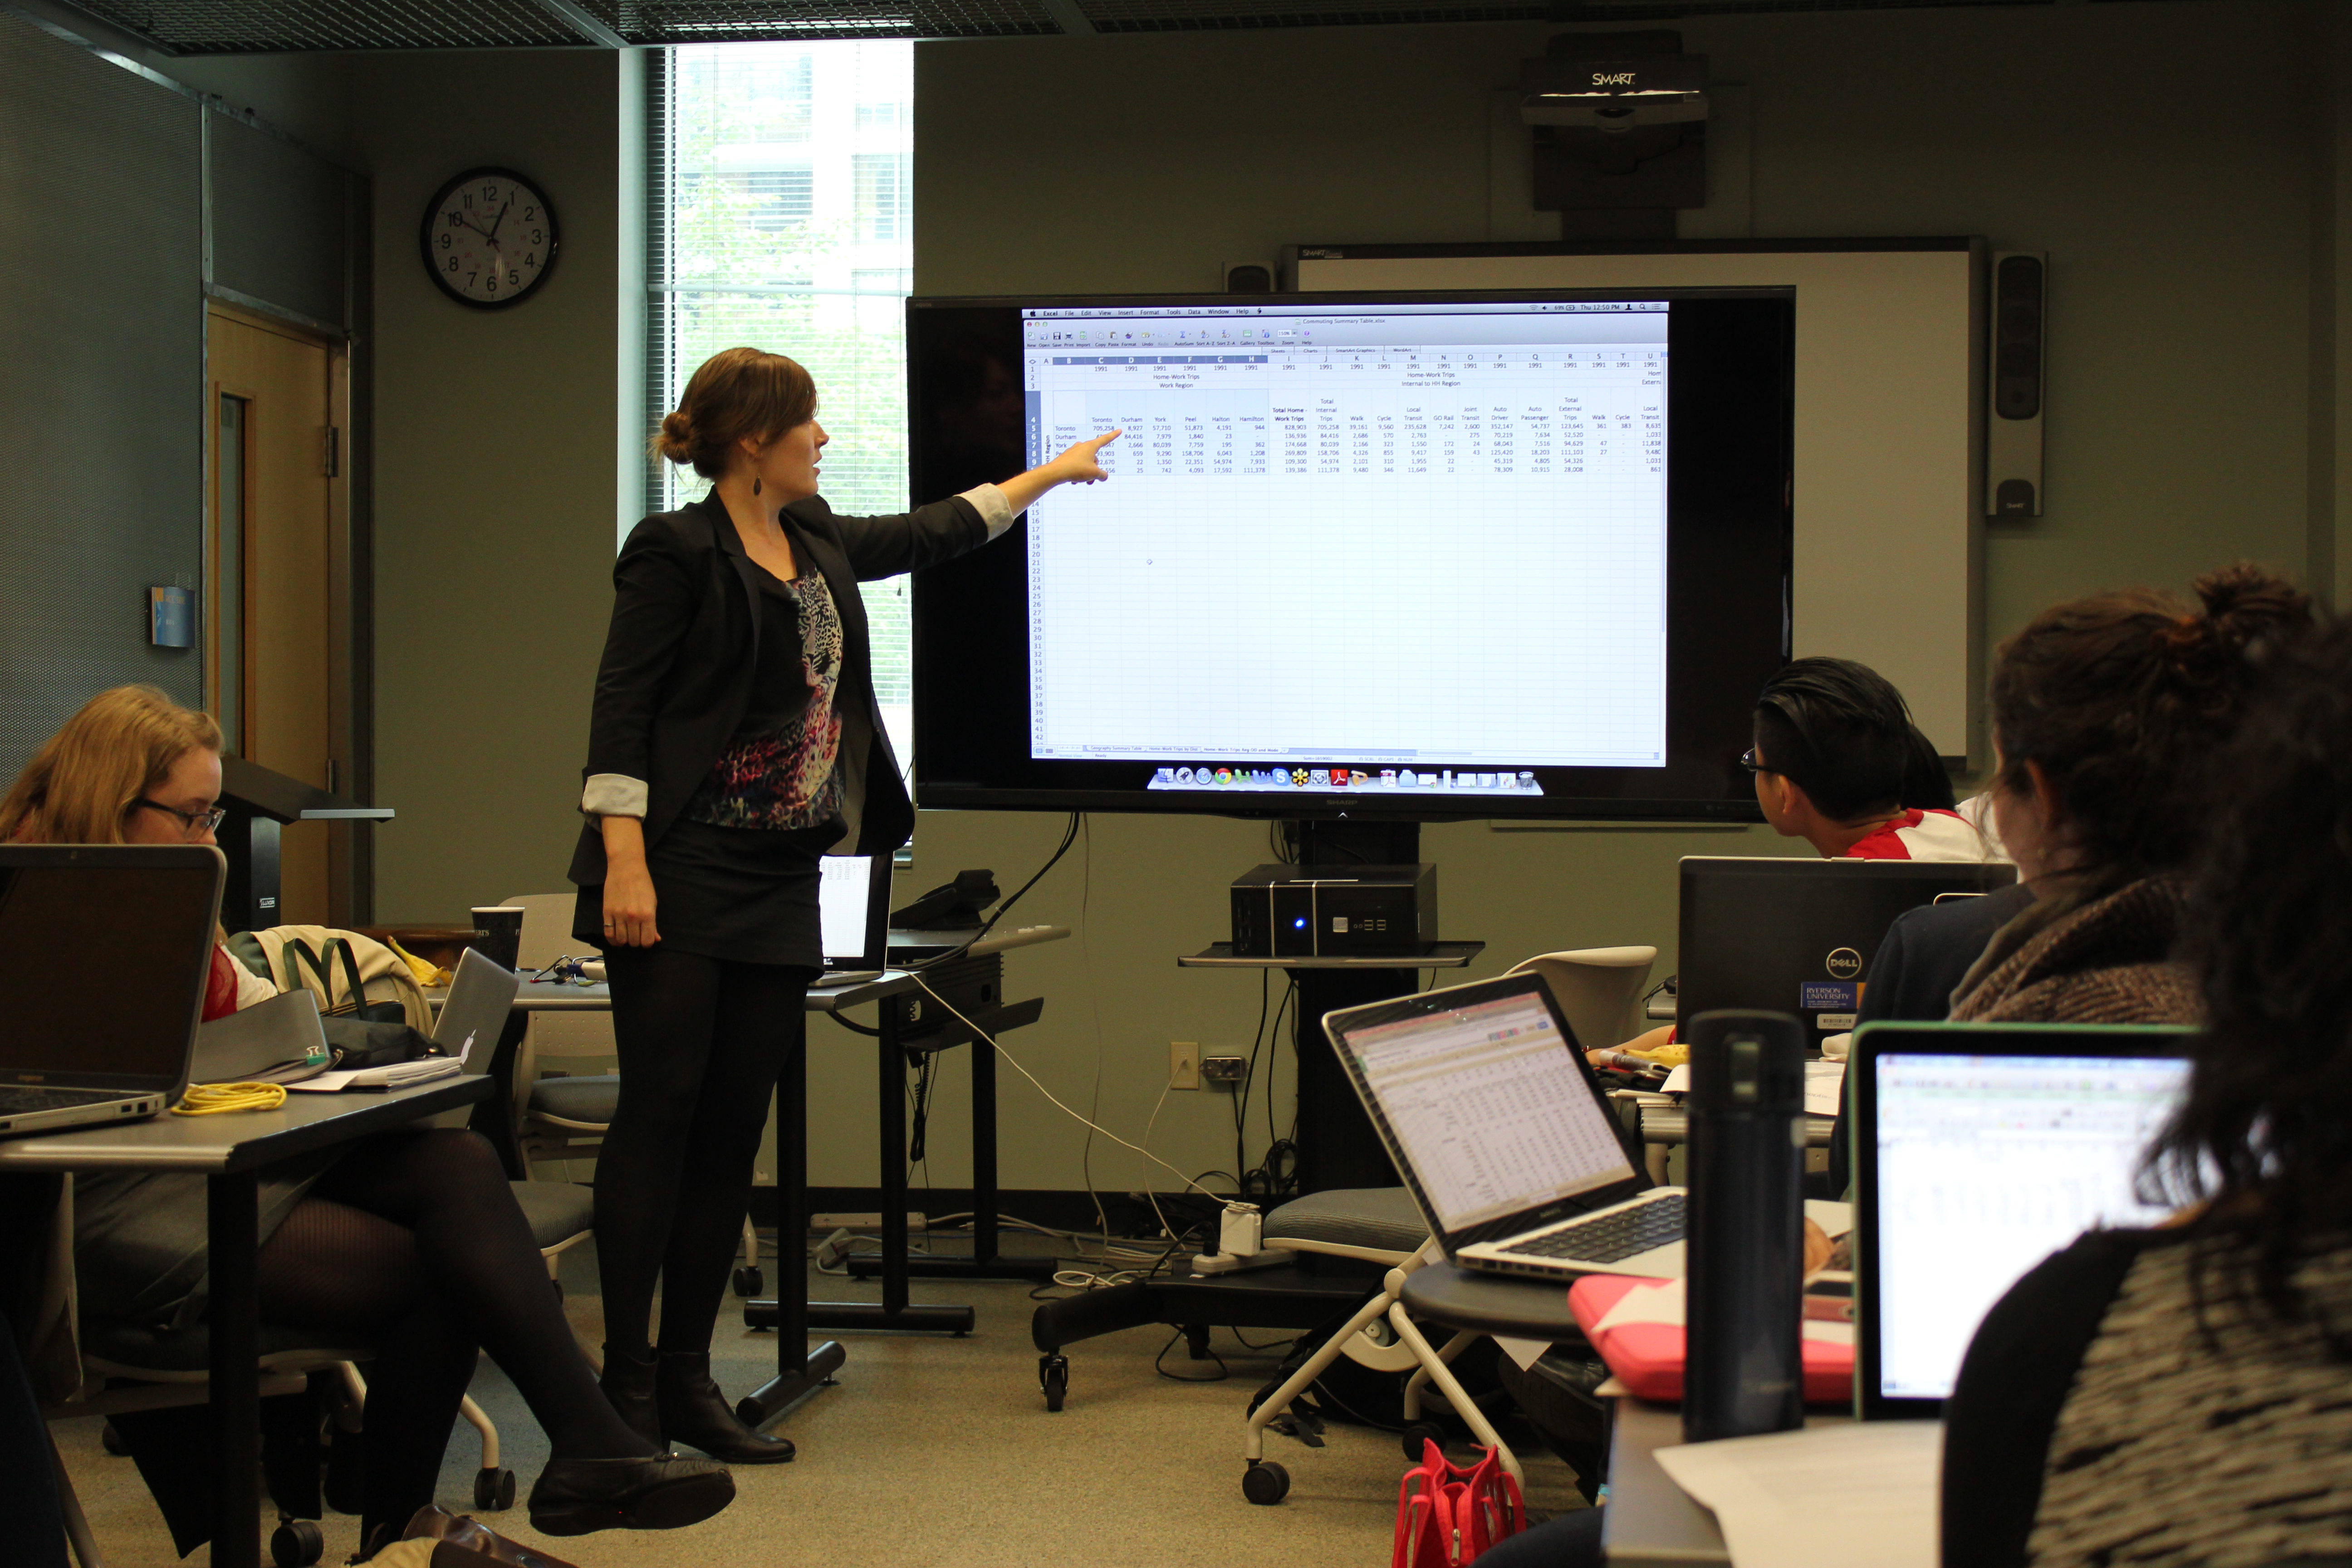
The morning began with 30-minute presentations from members of Geothink’s faculty. Peter Johnson, an assistant professor at Waterloo University’s Department of Geography and Environmental Planning, led off with a presentation on how municipal governments evaluate the success of their open data programs.
“This is the situation that we sort of find ourselves in when it comes to evaluating open data,” Johnson told students. “There’s this sort of world outside of government that’s bent on evaluating open data. And those are people like me, academics, those are non-profits, those are, you know, private sector organizations who are looking at open data and trying to understand how is it being used. So this is kind of, I think, a sign that open data has arrived a little bit. Right? It’s not just this sort of dusty, sort of nerdy cobweb in the corner of the municipal government basement. It’s something that other people are noticing and other people are taking an interest in.”
Johnson was followed by Teresa Scassa, Canada Research Chair in Information Law at the University of Ottawa, with a legal perspective on the value of open data. Pamela Robinson, associate professor in Ryerson University’s School of Urban and Regional Planning, gave a civic-oriented approach to the value of open data, one that was intentionally at odds with the private sector.
“I’ll be really blunt, I’m not that interested in making money from open data,” Robinson told students in regard to the common municipal reason for opening data. “It’s important but it’s not my thing. As an urban planner, my primary preoccupation is about citizen’s relationships with their government. And I’m interested in the proposition that open data as an input into open government can fundamentally shift the relationship between civil society and institutions.”
Finally, Geothink Head Renee Sieber, associate professor in McGill University’s Department of Geography and School of Environment, provided a summary of the methods for evaluating open data.
Each of these short lectures were part of a comprehensive look at open data during the three-day institute. Students at this year’s institute learned difficult lessons about applying actual open data to civic problems and on how to evaluate the success of an open data program. In between activities on day two, students also heard from a panel of municipal officials and representatives of Toronto-based organizations working with open data.
Held annually as part of a five-year Canadian Social Sciences and Humanities Research Council (SSHRC) partnership grant, each year the Summer Institute devotes three days of hands-on learning to topics important to research taking place in the grant. This year, each day of the institute alternated lectures and panel discussions with work sessions where instructors mentored groups one-on-one about the many aspects of open data.
But many students struggled not only with thinking about how to evaluate the open data that they were working with, but also with how to determine the impact of any project that utilizes such an information source.
“I think a big challenge that I personally am facing is this idea of it’s supposed to have real improvement for society, it’s suppose to help society,” Rachel Bloom, from McGill University, said. “But we find that a lot of vulnerable populations actually won’t have access to these applications and the technology. So it’s kind of like trying to reconcile this idea of helping while also being aware that like maybe you are not actually reaching the population you are trying to help. Which is kind of what openness is about—is actually engaging the people personally.”
It is for such reasons that evaluating open data can be quite nuanced—an idea represented in student group presentations on the topic. The presentations varied greatly with some student groups choosing metrics based on the things that a community might value and then establishing an outside monitor to observe datasets and report back to the community. Other students established a workflow to harness citizen input to evaluate open data through instruments such as online surveys.
-
- Group one evaluated open data metrics based on whether they were representative of a community.
-
- Group two established a workflow to harness citizen input to evaluate open data through instruments such as online surveys.
-
- Group three took on the role of being an independent watch dog auditing open data based on public engagement.
-
- Group four utilized a framework for evaluating open data that came from the Canadian Standards Association.
-
- Group five sought to measure open data portals by the quality of the data they provide.
-
- Group six argued that each open data set is unique and therefore concluded one standard would not work for them all but that citizen engagement may provide insight.
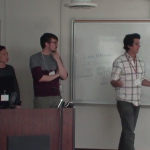
An afternoon panel comprised of local city officials and representatives from groups concerned with open data discussed the practical side of publishing, using, and evaluating open data as it stands today. The panel included Keith McDonald, former open data lead for City of Toronto; Bryan Smith, co-founder and Chief-Executive-Officer of ThinkData Works; Marcy Burchfield and Vishan Guyadeen, from The Neptis Foundation; And, Dawn Walker and Curtis McCord, Geothink students from University of Toronto who designed the Citizen’s Guide to Open Data.
Two of the primary concerns shared by panelists included the lack of standards for which differing municipalities provide open data, and the gap that exists between how open data is provided and what businesses or citizens require to actually use it. Smith spoke of how early visions of students and application developers using open data to radically transform life in cities have not scaled up to the national level particularly well.
“What we are seeing, which I don’t think anyone predicted, is the large companies—mostly companies that run a bunch of apps that probably everyone here has on their phones—are the ones who are the biggest purveyors of open data,” Smith told students. Issues with the type and quantity of data (as well as differences between how data is provided in different places) have limited other players and even some of these big developers too.
For more on this discussion, check out an excerpt of the panel discussion below. We pick up the discussion as the panelists talk about standards in relation to the Open Government Partnership.
In role-playing activities, students considered the issues raised by the panel as well as the practical problems citizens or other groups might face in finding the open data they require. Concluding presentations included those from students playing the role of real estate developers, non-profits concerned with democracy, and a bicycle food courier service.
Stay tuned for the full audio of each professors’ talk presented as podcasts here. Also check back on Geothink for a synopsis of day three, and, of course, watch more of our video clips (which we’ll be uploading in coming days) here.
If you have thoughts or questions about this article or the videos, get in touch with Drew Bush, Geothink’s digital journalist, at drew.bush@mail.mcgill.ca.