Category Archives: Research Project

Geothink Award Winner’s Research Brings Focus to City of Kelowna’s Homelessness Plan and Services to Those in Need

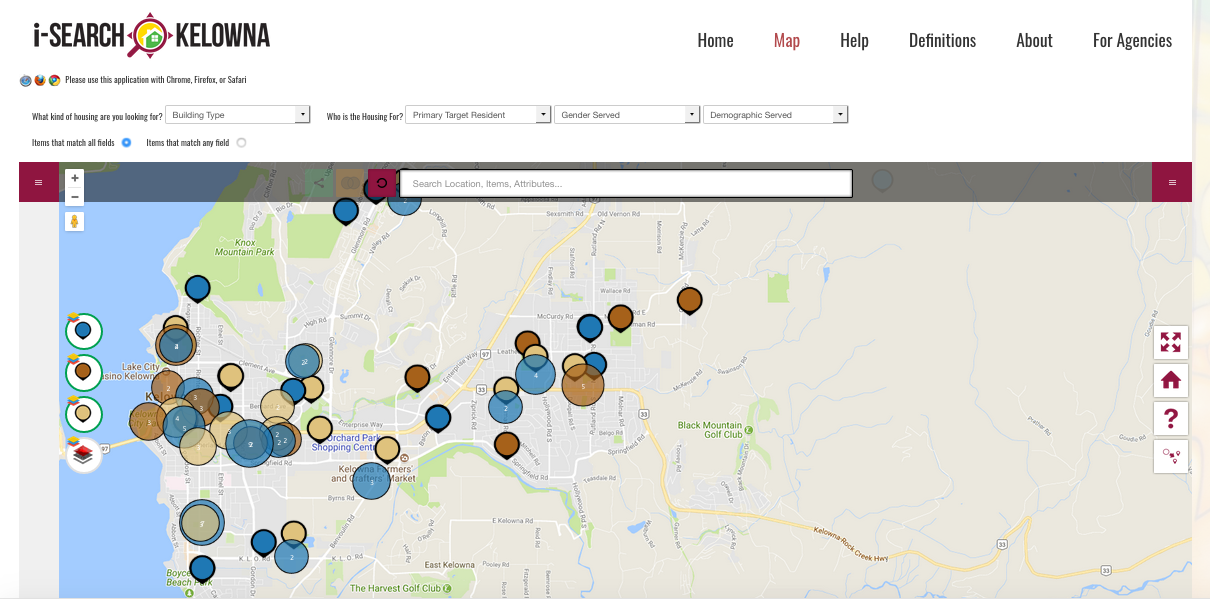
The iSearch Kelowna website is designed to assist individuals looking for low-income rentals, supportive housing or emergency shelters in the City of Kelowna.

By Drew Bush

One of the major challenge faced by anyone who finds themselves homeless involves finding shelter at places operated by a multitude of religious, goverment and nonprofit organizations. Thanks to the doctoral work of one Geothink student, that task just became a bit easier for those struggling with it in the City of Kelowna.

Shelley Cook, a Ph.D. Candidate at the University of British Columbia (UBC)-Okanagan, has worked with Geothink Co-Applicant Jon Corbett, an associate professor at UBC-Okanagan’s Department of Community, Culture and Global Studies, to design iSearch Kelowna. Via the app and website, individuals seeking low-income rentals, emergency shelter and drop-in services are able to search for live, user-specific information about resource availability within the city of Kelowna.

Shelley Cook, a University of British Columbia-Okanagan Ph.D. Candidate, developed the iSearch Kelowna site for her dissertation work.

“As we’ve moved out of phase one of our project, its morphing into another phase as it’s getting picked up as an important tool to inform this homelessness strategy, and people are running with it,” Cook said. In fact, this past summer the City of Kelowna decided to make iSearch Kelowna a central part of their strategy on homelessness. This highlighted Cook’s developing collaboration with the city on a project already supported by a team of reseachers, funders and partner organizations.

“It’s what we anticipated as what could happen and it’s lined up that way,” Cook said. “We’re maximising the benefit of the work that we’ve done, which is fantastic. It’s really in a strange way in its infancy, in terms of where it’s going to end up going, because it keeps evolving. So that’s been fantastic also.”

Cook’s work was recently recognized through Geothink’s first Dr. Alexander Aylett Scholarship in Urban Sustainability and Innovation (La Bourse Dr. Alex Aylett en Durabilité Urbaine et Innovation). The award was established in Aylett’s memory to provide vital support to graduate students sharing Aylett’s passion for, and commitment to, sustainable urban development.

Early feedback on iSearch Kelowna indicates that it is already providing users with a sense of ownership and advocacy over their own well-being and simplifying access to shelter information.

“It’s really about promoting empowerment, a greater sense of fairness and equity on the distribution of resources,” Cook said. “What we’ve done in terms of evaluation is directly talk to people who were formerly homeless or struggling with issues of maintaining adequate safe housing for themselves. That’s the one big thing they’ve talked about. And there’s lots of different elements around the interface that make it really usable and accessible.”

Speaking with Geothink during the Summer 2017 Summer Institute, Corbett added that issues of social and spatial justice motivate the research he and Cook have undertaken.

“There’s I think 84 different organizations that work on social justice related issues in and around the City of Kelowna,” Corbett said. “Which is kind of shocking because the population of Kelowna is only 185,000 people. So the fact that you’ve got 84 different organizations working is indicative of how serious the problem really is.”

He noted that the city and funding organizations for these services had started to notice that each individual service providers was acting in isolation. As a result, there was no centralized place to find specific services across the city such as a hot meal or housing if you are over 55-years-old.

The initial tool Corbett envisioned was going to be aimed at service-providers using real-time data to help coordinate where to send homeless people for specific services. That evolved as Corbett and Cook began discussing the project with the City of Kelowna. It now includes portals for a variety of different types of users—including the homeless themselves.

“For us, it’s been a whole set of reasonable technical challenges,” Corbett added. “But we’ve also been dealing obiviously with this very, very important social question.”

There are also endless applications for how the open data collected as a part of the project can make services more accessible and comprehensive for those in need. One worry has always been how to make what is a digital application accessible to a population that might not always have internet access.

“The main branch of the Kelowna library, a main point around Kelowna’s homeless community, has a dedicated monitor station during opening hours, is accessible for people to be able to search,” Cook said. “So it’s really about promoting service equity, and a greater sense of fairness and equity around the distribution of resources.”

“They now possess the knowledge,” she added of the homeless people using the site. “And what we know is they didn’t have the knowledge of all of [the city’s services]. So what that does is—the creating these forms of open data—opens up services to people and creates a more level playing field. Which is an incredibly powerful use of tools like this and was one thing that we weren’t necessarily anticipating.”

In the future, Cook plans to include more types of homeless services in the database and expand the site and offerings to other cities that have already expressed an interest in it.

“The final piece is an awareness raising and an ongoing partnership,” Cook said. “We’re doing presentations where communities have an interest in British Columbia and Alberta at this point. We can be of assistance in helping them develop a similar process and mentoring in that way.”

For Corbett and Cook, this means getting the project into the hands of city officials where it will live and exist for the community in perpetuity.

“So from the perspective of urban sustainability, we’re seeing municipalities, more so than in the past, getting involved with complex social issues like homelessness, and taking a lead role around these things,” Cook said. “Having a technological backbone that can help function not only to generate important information but to help people come together under a collective virtual umbrella. That’s a very powerful way to maximise and sustain existing community resources, and find innovative ways to create linkages and partnerships through tools and technology like iSearch Kelowna.”

###

If you have thoughts or questions about the article, get in touch with Drew Bush, Geothink’s digital journalist, at drew.bush@mail.mcgill.ca.

Geothink Student Shelley Cook Awarded Dr. Alexander Aylett Graduate Scholarship in Urban Sustainability and Innovation for Her Work Empowering Homeless Populations

Shelley Cook, a Ph.D. Candidate at the University of British Columbia (UBC)-Okanagan, will be the recipient of Geothink’s first Dr. Alexander Aylett Scholarship in Urban Sustainability and Innovation (La Bourse Dr. Alex Aylett en Durabilité Urbaine et Innovation).

By Sam Lumley

Shelley Cook, a University of British Columbia-Okanagan Ph.D. Candidate and the first Geothink Dr. Alexander Aylett scholarship recipient.

Shelley Cook, a Ph.D. Candidate at the University of British Columbia (UBC)-Okanagan, will be the recipient of Geothink’s first Dr. Alexander Aylett Scholarship in Urban Sustainability and Innovation (La Bourse Dr. Alex Aylett en Durabilité Urbaine et Innovation). Her project empowers homeless populations in the city of Kelowna by building new connections with homeless service providers such as community housing organizations.

“I think It’s hard for me to articulate how much it means to me,” Cook said of this honour. “I’m utterly blown away by the privilege.”

Cook’s research was recognized because it closely aligns with the late Dr. Aylett’s vision for urban sustainability. His legacy for creative and durable solutions to social justice issues in cities lives on in Cook’s work. Dr. Aylett passed away on July 23, 2016 from cancer leaving behind a rich legacy of research into how cities can provide solutions on topics such as climate change and social justice using digital technology and open data.

Geothink’s Dr. Alexander Aylett Scholarship in Urban Sustainability and Innovation was established in his memory, to provide vital support to graduate students sharing Aylett’s passion for, and commitment to, sustainable urban development.

“I think after spending my entire career working with extremely marginalized populations, I think it’s difficult work,” Cook said. “And it’s work that I’ve seen over the years—you know, people working with the most vulnerable in society—it’s work that’s often not acknowledged. So I think, for me, I’m utterly blown away by the privilege and the fact that it is for work that is helping people who are the most vulnerable in the community. And I just feel incredibly honored in that respect.”

The award recognizes exceptional research contributing to the field of urban sustainability, and represents one way in which Dr. Aylett’s work is continuing to generate innovative, far-reaching impacts.

“Alex was an exceptional person and his presence seems to continue to surround those who knew and loved him,” Richard Aylett, his father, said. “And so, it is important that an award in his name goes to a project of value.”

Alex’ family is equally honoured to award Cook’s research noting in a e-mail to Geothink that “her work on mapping resources for homelessness in British Columbia corresponds with volunteer work that Alex did for street youth in Vancouver and is thus very appropriate.”

Cook’s work addresses an important issue faced by many communities where homeless populations are not able to efficiently locate suitable temporary shelter. Housing seekers and service providers have often lacked access to centralised, searchable information on gender-specific services, housing location and capacity.

Geothink Co-Applicant Alexander C.E. Aylett who passed away July of last year.

To confront this problem, Cook developed the i-Search Kelowna web map application (app). Supervised by Geothink Co-Applicant Jon Corbett, an associate professor in Community, Culture and Global Studies at UBC-Okanagan, Cook’s work is also supported by a team of researchers, funders and partners. Via the app, individuals seeking low-income rentals, emergency shelter and drop-in services are able to search for live, user-specific information about resource availability within the city of Kelowna.

Early feedback on the tool indicates that it is already providing users with a sense of ownership and advocacy over their own well-being and simplifying access to shelter information.

“It’s really about promoting empowerment, a greater sense of fairness and equity on the distribution of resources,” Cook said.

The project mirrors past volunteer work undertaken by Aylett that supported marginalised communities and contributed to his vision of cities as thriving, safe, and inspiring places for everyone to live. These are all values which Cook shares in her own work.

Cook emphasizes that partnerships formed between researchers, municipalities, businesses and community members are crucial to the development and durability of the project. By deeply routing themselves in the community, the researchers have made sure that their work has progressed to meet evolving needs and issues.

“I think again diverse groups with common interests can come together and create something that benefits the broader community,” Cook explains.

“Homelessness takes different forms over time, so we needed to make sure this tool was responsive and continuously informing strategies and approaches to the long-term issues,” she adds.

In this respect, the project has so far enjoyed a large amount of success. The City of Kelowna has embraced the platform to not only provide housing services but to inform its homelessness strategies and decision-making processes.

The generous support from the Dr. Alexander Aylett Scholarship in Urban Sustainability and Innovation is invaluable for ensuring continued commitment to the idea of cities as sustainable and equitable sites for innovation and development.

###

If you have thoughts or questions about the article, get in touch with Sam Lumley, Geothink’s newsletter editor, at sam.lumley@mail.mcgill.ca.

Guide Provides Citizens Access to Open Data Literacy

The Geothink Citizen’s Guide for Open Data found at citizens-guide-open-data.github.io

By Drew Bush

Screenshot of the Geothink Citizen’s Guide to Open Data link on Geothink.ca.

You may have noticed a new banner gracing the front right portion of the Geothink.ca Web site starting last month. Click on it and it will take you to a key deliverable of this five-year partnership research grant funded by Canada’s Social Sciences and Humanities Research Council (SSHRC).

The Geothink Citizens Guide to Open Data was created by Curtis McCord and Dawn Walker, Geothink doctoral students in University of Toronto’s Faculty of Information, in collaboration with Geothink Co-Applicant Leslie Regan Shade, professor and associate dean for research in the faculty. It was first presented at Geothink’s 2016 Summer Institute at Ryerson University in Toronto when the duo were master’s students speaking on a panel.

“There’s actually still a big barrier where a lot of individual people aren’t using open data,” Walker said. “So we’re like in this moment, of saying, ‘Ok, open data has been lauded for all this potential promise.’ But it’s not exactly being used proportionally in the ways that are expected. From my experience, I’ve just seen a lot of companies or people who have very strong technical capabilities being able to work with open data. But there’s a lot of people who maybe have questions about their city or country that maybe open data can speak to. But like don’t—like wouldn’t even know to engage with it as a question you could ask of data. Or even know that open data would be a place they could go look to see.”

“These sorts of guides kind of help think about what those bridges could be,” Walker added. “And [they] address some of the literacies and capabilities required to even start to understand that you can ask questions that open data can answer.”

The Guide’s goal is to “provide citizens with tools to understand what makes up open data (OD), how it can be used in their communities, and where to find it.” Set up similarly to a Wiki page with drop-down menus, it consists of four sections on the right-hand bar entitled “Citizens Stories,” “Citizen Guide,” “Additional Resources,” and “About this Guide.”

The home page for the Guide notes that “People across Canada use technology that makes use of data as part of their daily lives” and increasingly are “starting to think about creative ways that this technology and data can be used to address issues they face in their communities and cities.” It adds that civic technology constitutes instances where “citizens come together to identify problems in their society or their community and solve them with data, computers, or expertise. Many kinds of data and their uses come up when we talk about open data and we’re going to know about them at the end of this guide.”

“It’s in no way kind of settled, right?” McCord said of the Guide. “We really intended this to be kind of a living document that people could update with their own stories or their own insights. We’re really open to ideas about how the kind of like stewardship of this thing might work. I mean, I’m much less committed to the content of the guide than I am to the idea that it can exist and be cared for. I’d rather it be everybody else’s ideas on their than mine. Because in a way, that shows it’s like kind of actually being put to work.”

McCord added that anyone interested in contributing can edit the guide by following simple instructions to use GitHub found at the bottom “Change This Guide!” link on the site. They can also e-mail the authors by clicking the “Feedback” link. Such contributions will represent the next step in the guide’s release to the public.

According to Shade, the first steps began directly as a result of her work with Geothink.

“The project began with my interest in exploring facets of data literacy, and more particularly with an interest in unpacking elements of open data for people and communities that were curious about it but not conversant with how to use open data,” she wrote in an e-mail. “Alexander Taciuk, our former [Geothink] Project Manager, was instrumental in encouraging me to pursue this project. And key to the project’s vision was the tremendous teamwork of Curtis McCord and Dawn Walker who worked on the Guide while finishing up their Master of Information degrees.”

“Curtis and Dawn wrote and designed the bulk of the Guide while also convening a small group within Geothink and locally to give advice on the content,” she added.

This year Shade engaged new students to continue work on several facets of the Guide including University of Toronto Master of Information students Dal Singh, Nicole Stradiotto and Mari Zhou and doctorate student Camille-Mary Sharp.

###

If you have thoughts or questions about the article, get in touch with Drew Bush, Geothink’s digital journalist, at drew.bush@mail.mcgill.ca.

Augmented Reality in Real Life: Evaluating the Potential of New Digital Tools for Use in Municipal Planning Practice

By: Laura Brown, Natalia Dmuchowska, Brodie Johnson, Teresa Liu, Corinna Prior, Matthew Zentner

Pokémon Go was a phenomenon that swept the world this past summer. Cities around the globe experienced an influx of citizens into their public spaces as everyone tried to ‘catch-em-all.’ Crazed Pokémon trainers wandered the city swiping their phones and battling to win gyms, ultimately searching for the coveted Pikachu. The significance of these movements within the urban environment has been covered here.

The game is based on augmented reality (AR) technology that overlays a game world on top of a live map of the city, creating new ways for players to interact with the spaces around them. While other applications like Google Maps and Foursquare use similar technology, it was Pokémon GO that became the first game to achieve widespread success.

Over the last three months, a group of graduate researchers from the School of Urban and Regional Planning at Ryerson University also caught the PokéFever and sought to explore more serious aspects of the game. Working with clients from the City of Toronto Manager’s Office and Public Consultation Unit, their research investigates the challenges that municipalities face in working with new and emerging technologies and how urban planners might be able to use similar technology to consult and engage with the public. The potential of AR technology such as Pokémon GO to alter the behaviour of people in real space presents both opportunities to attract people to certain locations and animate space, as well as concerns regarding public safety and security, and inequities arising from disparities in access.

Pokémon GO Findings
Conducting an exploratory analysis into the relationship between game data and demographic data, the team first investigated the distribution of PokéStops and PokéGyms throughout Toronto. In the game, PokéStops are locations where players receive items necessary for gameplay, and players may join one of three teams and “battle” for possession of PokéGyms. For their research, however, the team was interested in these landmarks as fixed locations that draw players to visit them in the real world. In addition, the locations of these markers were selected based on the Google database as well as player suggestions from a previous AR game by the same developer called Ingress. According to the developer, the markers that were frequented most by Ingress players became Gyms in Pokémon GO, and the others became PokéStops.

While 90% of people within the city lived within a five-minute walk of game elements, access varies significantly in terms of density, disproportionately making the game play experience much richer in the downtown core. Whereas overcrowding in open spaces and parks became the focus of media attention, there was actually a much higher concentration of game elements along major corridors like Queen Street. Narrowing our boundaries to just the downtown core, however, did reveal higher concentrations of gyms and stops in open spaces. These results were surprising and suggest the different forms that the public realm takes across the city.

Figure 1. Indicators of concentrated play spaces in the City of Toronto, as represented by the fixed landmarks in Pokémon GO (PokéStops and Gyms)

Public Realm
As we moved through our analysis, something meaningful emerged. We started to think about Stops and Gyms as indicators of concentrated play spaces. The map below depicts what happens when you remove the road lines – clusters of dots begin to reflect desire paths into areas of the public realm that were appropriated for game play. Rather than simply revealing the distribution of the game throughout the urban fabric, the placement of the Stops and Gyms hint at the fine-grained spaces that interconnect more formal “Open Spaces” across the city. This may contribute to a more nuanced view of the public realm, in addition to the more obvious areas defined by parks and open spaces.

Figure 2. PokéStops and Gyms in the City of Toronto, without road lines

Because many of the Stop and Gym locations were user generated and determined on the basis of usage (based on Niantic’s previous AR game Ingress), they may serve as indicators of where players might want to linger and occupy the public realm, as well as landmarks that hold cultural significance. While we recognize that this data only reflects a segment of the public, we think it might be possible for city planners to use this data in their analyses of streetscapes and cultural heritage, to better visualize existing public assets. Further it provides insight into how citizens use spaces in the city.

Augmented Reality and Planning
Current public consultation and engagement practices with citizens and stakeholders are predicated on in-person interaction, although they are increasingly occurring through online and other platforms. AR technology can draw people to new spaces and change the way they move around the city. Harnessing AR could bring new opportunities for reaching different demographics in the places where they live, work, and play.

We looked at the potential of using augmented reality technology to enhance development proposal signs through geo-location and visualization. Imagine walking down a street and receiving a notification on your smartphone for a nearby development proposal. By clicking it on it, the user is guided to the location where they are shown a visualization of the project conveniently through their phone. This would provide more meaningful information about the size and scale of the project, allowing people to see the full extent of the proposal in human scale and in context, while reviewing specific details right then and there.

Figure 3. Application of AR technology for visualization of a development project. Source: Augment

Finally, augmented reality can be used as a platform for public education and collaboration between community groups to enhance heritage planning and the public realm. This could potentially transform the whole city into a new type of living museum without borders, inspiring people to feel greater ownership over the city and its heritage.

Evaluating Technology for Planning
It is also necessary to understand how emerging technologies are created, implemented, and used. We have created an evaluative framework that explores the different areas planners must be aware of when evaluating new technology, an overview of which is shown in the figure below. These include the technical aspects and requirements (such as the platform of the technology), opportunities for greater engagement (ways to break down barriers like language and visual or auditory impairment), and potential inequalities and liabilities (such as data security concerns and differing abilities to access technology). Most importantly, this assessment allows planners to determine the usefulness of a technology in their daily planning practice.

Figure 4. Evaluative framework for planners for examining new technologies

The continually changing world of technology creates new opportunities that have the potential to enhance the way people interact with their city and the processes that govern it. We feel that planners are well placed to harness these emerging technologies to augment their cities in real life.

Although the Pokémon craze has since died down, it provided us with a unique opportunity to discover the potential of emerging technologies. We look forward to seeing what the future has in store for cities and for urban planners.

The full evaluative framework and results from the Pokémon GO analysis will be posted to the Geothink website shortly.

For more information please feel free to contact us at teampokeplan@gmail.com. Team PokéPlan is comprised of Laura Brown, Natalia Dmuchowska, Brodie Johnson, Teresa Liu, Corinna Prior and Matthew Zentner.

Thank you to our supervisor and Geothink co-applicant Dr. Pamela Robinson (Ryerson University, School of Urban and Regional Planning) and our clients at the City of Toronto!

Local News Map Will Be First To Highlight Disparities in Coverage Across Canada

The Local News Map launched by Geothink Co-Applicant Jon Corbett and Partner April Lindgren asks Canadian communities to report how news coverage has changed for them.

The Local News Map launched by Geothink Co-Applicant Jon Corbett and Partner April Lindgren asks Canadian communities to report how news coverage has changed for them.

By Drew Bush

The impact of newsroom cutbacks, consolidations, and closures across Canada will be the focus of a new crowdsourced online geoweb map. The public can contribute to it now—with the full map available online this June.

“The idea of the map is it will allow us to gather data that we have not been able to gather on our own just because there is so much data out there,” said Geothink Partner April Lindgren, an associate professor at Ryerson University’s School of Journalism and founding director of the Ryerson Journalism Research Centre.

The project stems from a belief that Canadians who live in smaller cities, suburban municipalities, and rural areas typically have fewer media outlets to turn to for media coverage. For that reason, the project’s list of communities includes municipalities that have experienced a major disruption in local news sources (such as the closure of a daily newspaper or television station).

The map will be one part of the project “Election News, local information and community discourse: Is Twitter the new public sphere?” that is headed by Jaigris Hodson, an assistant professor of Interdisciplinary Studies at Royal Roads University. Geothink Co-Applicant Jon Corbett, an associate professor in Community, Culture and Global Studies at the University of British Columbia, Okanagan, helped design it with his graduate students in the Spatial Information for Community Engagement (SPICE Lab) using the GeoLive platform featured in previous Geothink research.

“What we did is we went back to 2008 and we tried to find all the instances where a local news organization had either closed or scaled back service or something new had been launched,” Lindgren said in March while the map was being developed. “And so we populated the map as much as possible with information that we could find. But obviously there is lots and lots of other information out there that has happened since 2008. And there is probably lots of stuff going on right now that we do not know about.”

“So the idea of the crowdsourcing is it will allow us to obviously draw upon the expertise and knowledge of the local news landscape of people who live in communities,” she added. “And they will be able to contribute those pieces of information to the map to make it more robust and comprehensive.”

The map can document gains, losses, service increases, and service reductions at local online, radio, television and newspaper outlets across the country. Now that the map is open to contributions, members of the public can add information about changes to the local news landscape in their own communities. The map’s administrators will verify user submitted content so that the map remains accurate.


For a closer look at this project and the map, check out our video. In it, Corbett walks the user through a step-by-step view of the map and how to contribute while Lindgren discusses the importance of this work.


Making the Map

Many researchers have looked at the critical information needs of communities on topics such as education, health, security and emergency responses, Lindgren said. This in turn led her to think about how we know if there is adequate media provision in Canadian communities and where media have been lost or added. Still another related question is what online local news sites or social media have sprung up to fill any missing gaps.

Through attendance at last year’s Geothink Annual General Meeting in Waterloo, Lindgren was put in touch with Corbett. Eight months later, they had created a beta version of the map that included a couple hundred entries. Some emerging trends in the data include the consolidation and closure of community newspapers in Quebec and British Columbia.

“April had this idea that she wanted to better communicate information about how news media had changed over the period of the last eight years or so in Canada,” Corbett says of his meeting last May with Lindgren that began work by his lab to develop the map. “Because there really has been a lot of activity. Some newspapers have gotten larger. Others have closed down. There is a general move to web based media.”

His group has spent months ironing out the technical details of making this map presentable and ready for launch. Lindgren has provided feedback and advice on it through each stage.

“It has been an awful lot more complicated than we originally intended precisely because there has been so much activity and there is so much difference in this type of activity across Canada,” Corbett added. “For example, we have four major types of media. We have newspaper, we have radio, we have TV, and we have the web. And then within each one of those different types, we have a whole series of other information we need to convey.”

For example, the newspaper category of the map alone contains free dailies, free weeklies, and paid newspapers. It also must contain a measure of how such types have either declined or increased in different localities through time.

“And so we see all of this sort of compounding levels of complexity around the data that we need to present,” he said. “Because of course one of the problems with maps is to present information in an effective way require an awful lot of thought about the types of information being presented and how you actually present that type of information. It needs to be beautiful, it needs to be engaging, but it also needs to be informative.”

Corbett’s group has used color, typography, and more to make the map easily accessible to users. But he notes it is still a challenge to display all the transformations from January 2008 to the present. And the issue of time—as it is portrayed in the map—will only become more important as users begin to use it to display events taking place during specific years.

Getting Involved

Lindgren and Corbett are both excited for the map’s launch and the public’s participation. Right now the map needs richer input on new online news sites launched in Canada, Lindgren said. This is an issue she plans to keep an eye on when users begin contributing in greater frequency to determine to what extent these organizations are viable and fill gaps left by the closure of local newspapers and television stations.

Lindgren also believes the map has wide appeal to specific communities including local governments, individual community members, and journalists. She points out that in coming weeks there is a number of ways for the public to get involved.

“First of all, when they add a piece of data, they can comment,” Lindgren said. “Or they can comment on any other developments on the map that they want. And we have also incorporated a survey so that people can fill out the survey and tell us a little bit about where they go for their local news. Whether they feel adequately informed about various topics ranging from politics to education to other local issues.”

In case you missed it in the links above, find the map here to contribute your information: https://localnewsmap.geolive.ca/

###

If you have thoughts or questions about the article, get in touch with Drew Bush, Geothink’s digital journalist, at drew.bush@mail.mcgill.ca.

Inside Geothink’s Open Data Standards Project: Standards For Improving City Governance

By Rachel Bloom

Rachel Bloom is a McGill University undergraduate student and project lead for Geothink’s Open Data Standards Project.

In February, I led a Geothink seminar with city officials to introduce the results of our open data standards project we began approximately one year earlier. The project was started with the objective of assisting municipal publishers of open data in standardizing their datasets. We presented two spreadsheets: the first was dedicated to evaluating ‘high-value’ open datasets published by Canadian municipalities and the second consisted of an inventory of open data standards applicable to these types of datasets.

Both spreadsheets enable our partners who publish open data to know what standards exist and who uses them for which datasets. The project I lead is motivated by the idea that well-developed data standards for city governance can grant us the luxury of not having to think about the compatibility of technological components. When we screw in a new light bulb or open a web document we assume that it will work with the components we have (Guidoin and McKinney 2012). Technology, whether it refers to information systems or manufactured goods, relies on standards to ensure its usability and dissemination.

Municipal governments that publish open data look to the importance of standards for improving the usability of their data. Unfortunately, even though ‘high-value’ datasets have increasingly become available to the public, these datasets currently lack a consensus about how they should be structured and specified. Such datasets include crime statistics and annual budget data that can provide new services to citizens when municipalities open such datasets by publishing them to their open data catalogues online. Anyone can access such datasets and use the data however they wish without restriction.

Civic data standards provide agreements about semantic and schematic guidelines for structuring and encoding the data. Data standards specify technical data elements such as file formats, data schemas, and unique identifiers to make civic data interoperable. For example, most datasets are published in CSV or XML formats. CSV structures the data in columns and rows, while XML encapsulates the data in a hierarchical tree of <tags>.

They also specify common vocabularies in order to clarify interpretation of the data’s meanings. Such vocabularies could include, for example, definitions for categories of expenditure in annual budget data. Geothink’s Open Data Standards Project offers publishers of open data an opportunity to improve the usability and efficiency of their data for consumers. This makes it easier to share data across municipalities because the technological components and their meanings within systems will be compatible.

Introducing Geothink’s Open Data Standards Project
No single, clear definition of an open data standard exists. In fact, most definitions of an ‘open data standard’ follow two prevailing ideas: 1) Standards for open data; 2) And, open standards for data. Geothink’s project examines and relates together both of these prevailing ideas (Table 1). The first spreadsheet, the ‘Adoption of Open Data Standards By Cities’, considers open data and its associated data standards. The second spreadsheet, the ‘Inventory of Open Data Standards,’ considers the process of open standardization. In other words, we were curious about what standards are currently being applied to open municipal data, and how to break down and document open standards for data in a way that is useful to municipalities looking to standardize their open data.

Table 1: Differences between ‘open data’ standards and open ‘data standards’

Requires open data Requires open standard process
Evaluation of ‘High-Value’ Datasets Yes No
Inventory of Open Data Standards No Yes

The project’s evaluation of datasets relates to standards for open data. Standards for open data refer to standards that, regardless of how they are developed and maintained, can be applied to open data. Open data, according to the Open Knowledge Foundation (2014), consists of raw digital data that should be freely available to anyone to use, repurposable and re-publishable as users wish, and absent mechanisms of control like restrictive licenses. However, the process of developing and maintaining standards for open data may not require transparency nor include public appeals for its development.

To discover what civic data standards are currently being used, the first spreadsheet, Adoption of Open Data Standards By Cities, evaluates ‘high value’ datasets specific to 10 domains (categories of datasets such as crime, transportation or or service requests) in the open data catalogues for the cities of Vancouver, Toronto, Surrey, Edmonton and Ottawa. The types of data were chosen based on the Open Knowledge Foundation’s choice of datasets considered to provide greatest utility for the public. The project’s spreadsheet notes salient structuring and vocabulary of each dataset; such as the name, file format, schema, and available metadata. It especially notes which data standards these five municipalities are using for their open data (if any at all).

With consultation from municipal bodies and organizations dedicated to publishing open data, we developed a second spreadsheet, Inventory and Evaluation of Open Data Standards,  that catalogues and evaluates 22 open data standards that are available for domain-specific data. The rows of this spreadsheet indicate individual data standards. The columns of this spreadsheet evaluate background information and quality for achieving optimal interoperability for each of the listed standards. Evaluating the quality of the standard’s performance, such as whether the standard is transferable to multiple jurisdictions, is an important consideration for municipalities looking to optimally standardize their data. Examples of open data standards in this inventory are BLDS for building permit data and the Budget Data Package for annual budget data.

The project’s second spreadsheet is concerned with open standards for data. Open standards, as opposed to closed standards, requires a collaborative, transparent, and consensus-driven process to maintain its development (Palfrey and Gasser, 2012). Therefore, open standards honor a commitment to processes of transparency, due process, and rights of appeal. Similarly to open data, open standards resist processes of unchecked, centralized control (Russell, 2014) . Open data standards make sure that end users do not get locked into a specific technology. In addition, because open standards are driven by consensus, they are developed according to the needs and interests of participatory stakeholders. While we provide spreadsheets on both, our project advocates implementing open standards for open data.

In light of the benefits of open standardization, the metrics of the second spreadsheet note the degree of openness for each standard. Such indicators of openness include multi-stakeholder participation and a consensus-driven process. Openness may be observed through the presence of online forums to discuss suggestions or concerns regarding the standard’s development and background information about each standard’s publishers. In addition, open standards use open licenses that dictate the standards may be used without restriction and repurposable for any use. Providing this information not only allows potential implementers to be aware of what domain-specific standards exist, but also allows them to gauge how well the standard performs in terms of optimal interoperability and openness.

Finally, an accompanying white paper explains the two spreadsheets and the primary objective of my project for both publishers and consumers of open data. In particular, it explains the methodology, justifies chosen evaluations, and notes the project’s results.  In addition, this paper will aid in navigating and understanding both of the project’s spreadsheets.

Findings from this Project
My work on this project has led me to conclude that the majority of municipally published open datasets surveyed do not use civic data standards. The most common standard used by municipalities in our survey was the General Transit Feed Specification (GTFS) for transit data and the Open311 API for service request data. Because datasets across cities and sectors vary formats and structure, differences in them coupled with a lack of cohesive definitions for labeling indicate standardization across cities will be a challenging undertaking. Publishers aiming to extend data shared among municipalities would benefit from collaborating and agreeing on standards for domain-specific data (as is the case with GTFS).

Our evaluation of 22 domain-specific data standards also shows standards do exist across a variety of domains. However, some domains, such as budget data, contain more open data standards than others. Therefore, potential implementers of standards must reconcile which domain-specific standard best fits their objectives in publishing the data and providing the most benefits for public good.

Many of standards also contain information for contacting the standard’s publishers along with online forums for concerns or suggestions. However, many still full information regarding their documentation or are simply in early draft stages. This means that although standards exist, some of these standards are in their early stages and may not be ready for implementation.

Future Research Pathways
This project has room for growth so that we can better our partners who publish and use open data decide how to go about adopting standards. To accomplish this goal, we could add more cities, domains, and open standards to the spreadsheets. In addition, any changes made to standards or datasets in the future must be updated.

In terms of the inventory of open data standards, it might be beneficial to separate metrics that evaluate openness of a standard from metrics that evaluate interoperability of a standard. Although we have emphasized the benefits of open standardization in this project, it is evident that some publishers of data do not perceive openness as crucial for the successfulness of a data standard in achieving optimal interoperability.

As a result, my project does not aim to dictate how governments implement data standards. Instead, we would like to work with municipalities to understand what is valued within the decision-making process to encourage adoption of specific standards. We hope this will allow us to provide guidance on such policy decisions. Most importantly, to complete such work, we ask Geothink’s municipal partners for input on factors that influence the adoption of a data standard in their own catalogues.

Contact Rachel Bloom at rachel.bloom@mail.mcgill.ca with comments on this article or to provide input on Geothink’s Open Data Standards Project.

References
Guidoin, Stéphane and James McKinney. 2012. Open Data, Standards and Socrata. Available at http://www.opennorth.ca/2012/11/22/open-data-standards.html. November 22, 2012.
Open Knowledge. Open Definition 2.0. Opendefinition.org. Retrieved 23 October 2015, from http://opendefinition.org/od/2.0/en/
Palfrey, John Gorham, and Urs Gasser. Interop: The promise and perils of highly interconnected systems. Basic Books, 2012.
Russell, Andrew L. Open Standards and the Digital Age. Cambridge University Press, 2014.

Local News Research Project map of Toronto news coverage

Crosspost: How is your Toronto neighbourhood portrayed in the news? Check it out using these interactive maps

This post is cross-posted with permission from April Lindgren and Christina Wong at Local News Research Project. 

By April Lindgren and Christina Wong

Introduction
Concerns about how neighbourhoods are portrayed in the news have surfaced regularly in the Toronto area over the years. But are those concerns valid?

Interactive maps produced by the The Local News Research Project (LNRP) at Ryerson University’s School of Journalism are designed to help Toronto residents answer this question. The maps give the public access to data the research project collected on local news coverage by the Toronto Star and the online news website OpenFile.ca. The maps can be used by members of the public and researchers to:

  • get an overall sense of where news in the city is – and isn’t – covered
  • compare patterns of local news coverage by two different news organizations
  • examine the city-wide geographic patterns of reporting on crime, entertainment and other major news topics
  • examine news coverage in each of Toronto’s 44 wards including how often the news stories and photographs reference locations in a ward
  • see what story topics are covered in each ward

The maps are based on the Toronto Star’s local news coverage published on 21 days between January and August, 2011. Researchers have found that a two-week sample of news is generally representative of news coverage over the course of a year (Riffe, Aust & Lacy, 1993). The data for OpenFile.ca, which suspended publishing in 2012, were collected for every day in 2011 between January and August.

Click here to see the maps or continue reading to find out more about news coverage and neighbourhood stereotyping, how the maps work, and the role of open data sources in this project.


Local news and neighbourhood stereotyping
The decision to explore news coverage of Toronto neighbourhoods was prompted by concerns expressed by citizens and local politicians about how certain parts of the city are portrayed in the local media. Residents were furious (Pellettier, Brawley & Yuen, 2013), for instance, when Toronto Star columnist Rosie Dimanno referred to the city’s Scarborough area as “Scarberia” in an article about former mayor Rob Ford’s re-election campaign (DiManno, 2013). Back in 2007, then-mayor David Miller went so far as to contact all of the city’s news media asking them to cite the nearest main intersection rather than reporting more generally that a particular crime occurred in Scarborough (Maloney, 2007). In Toronto’s west end, the local city councillor suggested negative connotations associated with the Jane and Finch neighbourhood could be diffused by renaming it University Heights, but the idea was vehemently rejected by residents (Aveling, 2009).

A study that investigated how Toronto’s most disadvantaged neighbourhoods were covered by the Toronto Star concluded that there was very little coverage of news in these communities (Lindgren, 2009). The study, which examined Toronto Star local news reporting in 2008, also found that crime tended to dominate the limited coverage that did take place and suggested the problem could be rectified not by ignoring crime stories, but by increasing coverage of other sorts of issues in those communities.


Exploring the maps
The interactive maps allow users to explore local news coverage in the City of Toronto. A sample of local stories and photographs from the Toronto Star (the local newspaper with the largest circulation in the city) and OpenFile.ca (a community-based news website) were identified and analyzed in 2011 to capture data about story topics and mentions of geographic locations.

These maps make the data available to the public in a way that allows users to explore and compare media coverage in different areas of the city. Users can zoom in on a neighbourhood and discover all of the locations referenced within a neighbourhood. Each point on the map represents a location that was referenced in one or more news items. Users can click on any of these points to see a list of news articles associated with each location (Figure 1).

Figure 1. Users can click each point to find out about the news articles that referenced the location

By clicking within a ward boundary, users can also access a summary chart describing the breakdown by subject of all local news coverage in that ward. Users interested in the Scarborough area, for instance, can zoom into that area on the map and click on each Scarborough ward to see what sorts of stories (crime, transit, entertainment, sports, etc.) were reported on in that ward (Figure 2).

Figure 2. Users can click within a ward to access charts summarizing news coverage by topic

Users interested in how and where a particular news topic is covered can access separate interactive maps for the top five subjects covered by the two news sources. Figure 3, for example, shows all locations mentioned in crime and policing stories published by the Toronto Star during the study’s sample period.

Figure 3. Toronto Star coverage of crime and policing news

The role of open data sources in creating these maps
A total of 23 pre-existing datasets were used to support the creation of these interactive maps including relevant open datasets that were publically available online in 2008. The datasets were used to populate a list of geographic locations in the GTA that had the potential to be referenced in local news stories. Each dataset was assigned unique numerical codes and all 23 datasets were appended to a geographic reference table that coders could search. The incorporated reference list of geographic locations and features allowed for a more accurate and efficient coding process: Coders entering information about spatial references in local news items were able to select many of the referenced geographic locations from the pre-populated list rather than entering the information manually. This improved accuracy because it helped prevent human error and also sped up the coding process.

We would have preferred to use more open data sources during the initial development of the database, but this wasn’t possible due to limited availability of datasets with the spatial attributes that make mapping possible. At that time, only two of the 23 datasets used (approximately 8.7% of the total) were available from open data sources in a format that included geography (such as shapefiles). Both files were obtained from the City of Toronto’s Open Data website. These limitations meant that the majority of the database relied on contributions from private data sources.

The situation has improved over time as more open government data become available in geographic file formats that support research with spatial analysis. As of mid-2015, six more of the 23 datasets (two federal, one provincial and three municipal) used in the database have become available. If we were creating the database today, a total of eight datasets or 34.8% of the initial database could be populated using open data sources (Table 1).

Table 1. Availability of open data sources
Available in 2008 when the database was created Currently available
Private sources 21 15
Government open data 2   (8.7% of database) 8 (34.8% of database)
Total # of datasets 23 23


Since 2008, the Government of Canada has launched its own open data portal, joined the Open Government Partnership alongside other countries supporting the release of open government data, and adopted the G8 Open Data Charter (Standing Committee on Government Operations and Estimates, 2014). Provincial and municipal governments have made similar improvements to open data access. The Government of Ontario launched an online open data catalogue in 2012 and is currently developing an Open Data Directive to be implemented later this year (Fraser, 2015). The City of Toronto introduced its open data portal in 2009 and developed an Open Data Policy in 2012 (City of Toronto, n.d.).

As Table 1 suggests, however, further improvements are required to reduce barriers to research and innovation. A report from the Standing Committee on Government Operations and Estimates, for instance, recommended that the federal government provide data at smaller levels of geography, work together with different levels of government to establish standards and release data, and provide a greater variety of open data to reflect all government departments. The report noted that the release of open data can improve government efficiency, foster citizen engagement, and encourage innovation (Standing Committee on Government Operations and Estimates, 2014). Academic researchers have argued that improvements in the availability of open government data would stimulate valuable research and outcomes with economic and social value (Jetzek, Avital & Bjorn-Andersen, 2014; Kucera, 2015; Zuiderwijk, Janssen & Davis, 2014). Journalists are also pushing for easier and greater access to data (Schoenhoff & Tribe, 2014).


Conclusion
Research conducted by the Local News Research Project was made possible by public funds and as such the data should be widely available. The interactive maps are an attempt to fulfill that obligation.

While the maps capture only a snapshot of news coverage at a fixed point in time, they nonetheless demonstrate the importance of geospatial analysis in local news research (Lindgren & Wong, 2012). They are also a powerful data visualization tool that allows members of the public to independently explore media portrayals of neighbourhoods and the extent to which some parts of a city are represented in the news while others are largely ignored.

Finally, this mapping project also illustrates how open government data can foster research and how much there is still to do in terms of making data available to the public in useful formats.


The Local News Research Project was established in 2007 to explore the role of local news in communities. Funding for this research has been provided by Ryerson University, CERIS-The Ontario Metropolis Centre and the Social Sciences and Humanities Research Council.

About the authors: Lindgren is an Associate Professor in Ryerson University’s School of Journalism and Academic Director of the Ryerson Journalism Research Centre. Christina Wong is a graduate of Ryerson University’s Geographic Analysis program. Initial work on the maps was done in 2014 by GEO873 students Cory Gasporatto, Lorenzo Haza, Eaton Howitt and Kevin Wink from Ryerson University’s Geographic Analysis program.


References

Avaling, N. (2009, January 8). Area now being called University Heights, but some call change a rejection of how far we’ve come. Toronto Star, p. A10.

City of Toronto. (n.d.). Open Data Policy. Retrieved from http://www1.toronto.ca/wps/portal/contentonly?vgnextoid=7e27e03bb8d1e310VgnVCM10000071d60f89RCRD

DiManno, R. (2013, July 6). Ford fest makes a strategic move. Toronto Star, p. A2.

Jetzek, T., Avital, M. & Bjorn-Andersen, N. (2014). Data-driven innovation through open government data. Journal of Theoretical and Applied Electronic Commerce Research, 9(2), 100-120.

Fraser, D. (2015, May 1). Ontario announces more open data, public input. St. Catharines Standard. Retrieved from http://www.stcatharinesstandard.ca/2015/05/01/ontario-announces-more-open-data-public-input

Kucera, J. (2015). Open government data publication methodology. Journal of Systems Integration, 6(2), 52-61.

Lindgren, A. (2009). News, geography and disadvantage: Mapping newspaper coverage of high-needs neighbourhoods in Toronto, Canada. Canadian Journal of Urban Research, 18(1), 74-97.

Lindgren, A. & Wong, C. (2012). Want to understand local news? Make a map. 2012 Journalism Interest Group proceedings. Paper presented at Congress 2012 of the Humanities and Social Sciences conference. Retrieved from http://cca.kingsjournalism.com/?p=169

Maloney, P. (2007, January 16). Mayor sticks up for Scarborough. Toronto Star. Retrieved from http://www.thestar.com/news/2007/01/16/mayor_sticks_up_for_scarborough.html?referrer=

Pellettier, A., Brawley, D. & Yuen, S. (2013, July 11). Don’t call us Scarberia [Letter to the editor]. Toronto Star. Retrieved from http://www.thestar.com/opinion/letters_to_the_editors/2013/07/11/dont_call_us_scarberia.html

Riffe, D., Aust, C. F. & Lacy, S. R. (1993). The effectiveness of random, consecutive day and constructed week sampling. Journalism Quarterly, 70, 133-139.

Schoenhoff, S. & Tribe, L. (2014). Canada continues to struggle in Newspapers Canada’s annual FOI audit [web log post]. Retrieved from https://cjfe.org/blog/canada-continues-struggle-newspapers-canada%E2%80%99s-annual-foi-audit

Standing Committee on Government Operations and Estimates. (2014). Open data: The way of the future: Report of the Standing Committee on Government Operations and Estimates. Retrieved from http://www.parl.gc.ca/content/hoc/Committee/412/OGGO/Reports/RP6670517/oggorp05/oggorp05-e.pdf

Zuiderwijk, A., Janssen, M. & Davis, C. (2014). Innovation with open data: Essential elements of open data ecosystems. Information Polity, 19(1, 2), 17-33.

Decision-Making with Uncertain Data

Professor Scott Bell

Director, The Spatial Initiative

University of Saskatchewan

117 Science Place, Saskatoon, SK S7N 3C8

Governments have long provided their citizens with high quality data through centralized services. Generally, these are collected as a population census with an additional and more detailed sampled survey. In Canada, the former is known as the short form census and the latter was called the long form until 2010. The short form provides an accurate count of the total population at the time of the census, while the long form has provided more detailed information about our people. In Canada, the census is collected every 5 years by Statistics Canada (StatsCan), an agency of the federal government. In 2010 an Order in Council altered the past practice of a simultaneous short and long form census to a separate short form and National Household Survey (NHS). The primary difference between the NHS and the long form is that the NHS is not mandatory, whereas the long form was compulsory by law. There have been concerns from many different stakeholders about the value of the NHS as a statistically valid and reliable representation of Canada’s people. StatsCan is not alone in transitioning to a different detailed data collection tool. The US Census has changed the way it collects such data as well; with the introduction of the American Community Survey (ACS). In doing this, they have switched from a decennial short and long form census to a decennial short form census and an annual detailed survey (the ACS). This research will contextualize the introduction of the NHS in Canada with the ACS in the United States.