Tag Archives: OSM

A New Narrative for Collecting Statistical Data: Statistics Canada’s Crowdsourcing Project

This is a guest post from Statistics Canada on their new initiative on crowdsourcing geospatial data

Statistics Canada’s crowdsourcing project offers an exciting new opportunity for the agency to collaborate with stakeholders and citizens to produce and share open data with the general public — that is to say, data that can be freely used and repurposed.

Data collection is evolving with technology; for example, paper-based and telephone surveys are increasingly replaced with online surveys. With an array of modern technologies that most Canadians can access, such as Web 2.0 and smartphones, a new mechanism for data sharing can be piloted through open data platforms that host online crowds of data contributors. This project provides insight into how Statistics Canada can adapt these modern technologies, particularly open source tools and platforms, to engage public and private stakeholders and citizens to participate in the production of official statistics.

For the pilot project, Statistics Canada’s goal is to collect quality crowdsourced data on buildings in Ottawa and Gatineau. The data include attributes such as each building’s coordinate location, address and type of use. This crowdsourced data can fill gaps in national datasets and produce valuable information for various Statistics Canada divisions.

On September 15, 2016, Statistics Canada launched a web page and communications campaign to inform and motivate the citizens of Ottawa and Gatineau to participate in the pilot project. This pilot project is governed and developed by Statistics Canada’s Crowdsourcing Steering Committee. Statistics Canada’s communications with the local OpenStreetMap (OSM) community and collaboration with stakeholders and municipalities have allowed the pilot project to succeed.

To crowdsource the data, the project uses OpenStreetMap, an open source platform that aims to map all features on the Earth’s surface through user-generated content. OSM allows anyone to contribute data and, under the Open Data Commons Open Database License (ODbL), anyone can freely use, disseminate and repurpose OSM data. In addition to the web page and campaign to encourage participation, Statistics Canada developed and deployed a customized version of OSM’s iD-Editor. This adapted tool allows participants to seamlessly add points of interest (POIs) and polygons on OSM. The platform includes instructions on how to sign up for OSM and how to edit, allowing anyone, whether tech-savvy or not, to contribute georeferenced data (Figure 1).
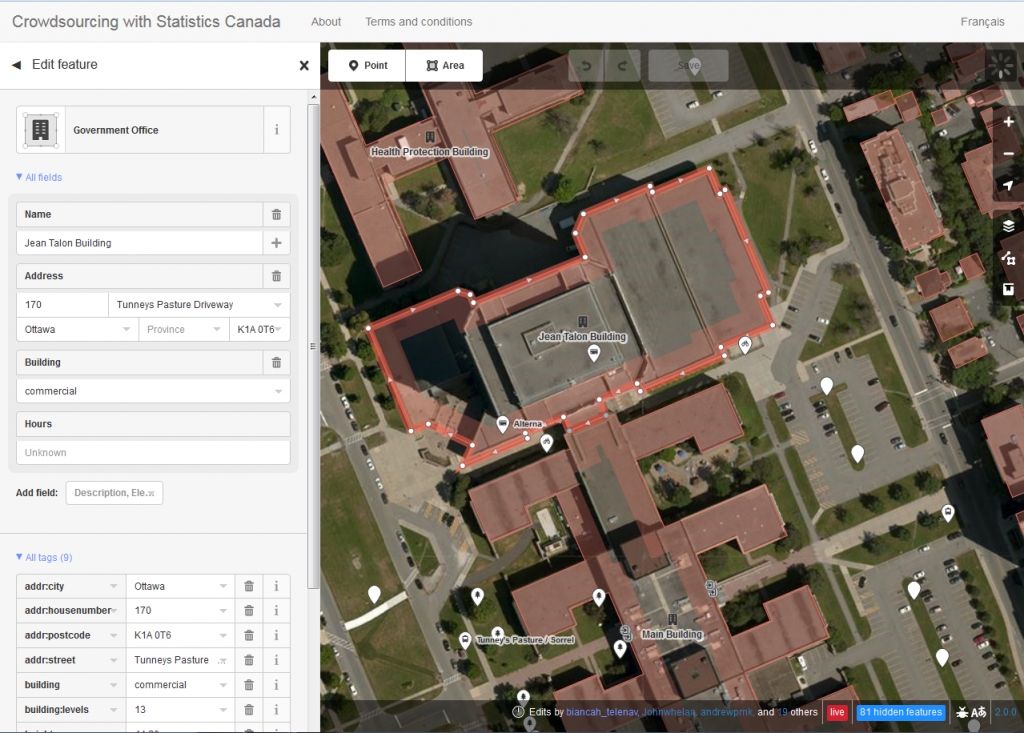
Figure 1. Snapshot of the customized version of OSM’s iD-Editor. Users can select a building or POI to see the attributes. Users can edit these attributes or they can create an entirely new point or area.

Statistics Canada has maintained communications with its stakeholders and participants through outreach, and has monitored contributions through dashboards. Outreach has taken place by communicating with the global and local OSM communities by using mailing lists and having local meetups, as well as by organizing webinars, presenting at local universities and participating in conferences associated with open data. Negotiation and collaboration with the City of Ottawa have also opened building footprints and addresses for contributors to add to the map.

The project has been monitored using an open source dashboard developed by Statistics Canada. The dashboard provides a timeline (currently covering August 2016 to February 15, 2017) that specifies the number of buildings mapped, the number of users and the average number of tags contributed on OSM in each target city. Furthermore, it shows the amount of certain building types (e.g., house, residential, commercial) and the number of missing address fields by percentage (Figure 2). In general, the dashboard highlights the increased OSM contributions in Ottawa and Gatineau since the initiation of the project.
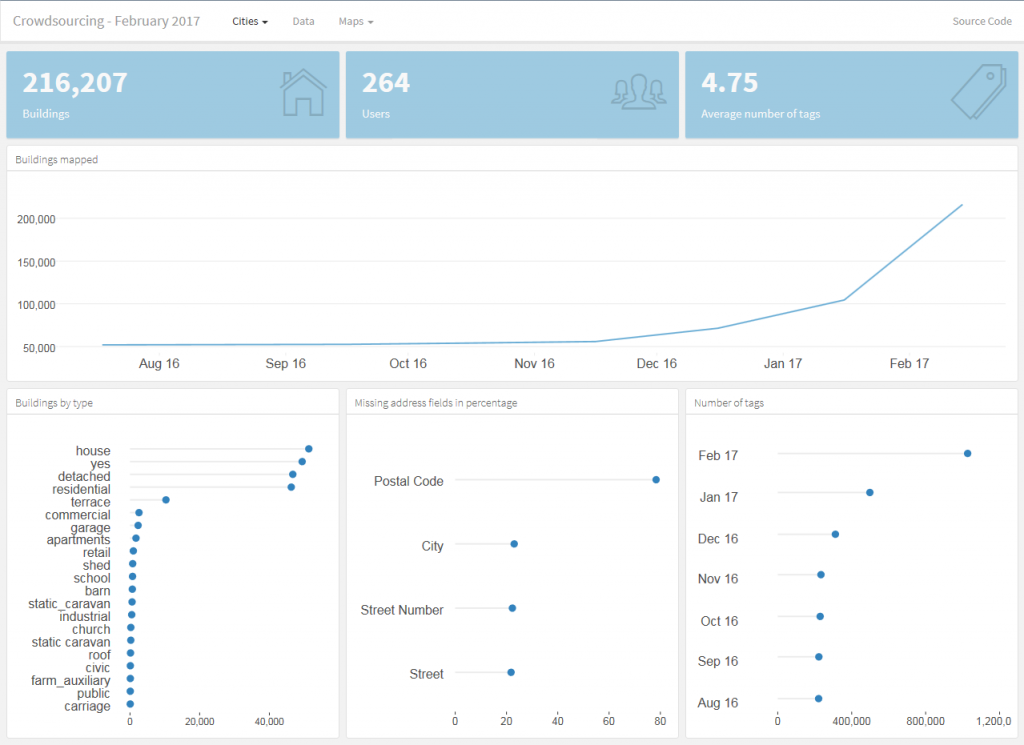
Figure 2. The open source dashboard monitors the production of data on OSM within the pilot project’s geographic scope of Ottawa and Gatineau. In the image above, both Ottawa and Gatineau have been selected. As seen in the top graph, buildings mapped in both cities have increased since the project’s initiation.

In the second year of the pilot project, Statistics Canada intends to develop a mobile app that will allow contributors to map on the go. Outreach will be maintained and, as more data are collected, quality assessments will be conducted. Success has been derived through collaborations, learning and sharing ideas, and developing user-friendly open source tools. As the project expands over time, Statistics Canada will uphold these values and approaches to ensure both an open and collaborative environment.

If you are interested in participating in the project, visit Statistics Canada’s Crowdsourcing website for a tutorial or to start mapping. Feel free to contact us at statcan.crowdsource.statcan@canada.ca to subscribe to a distribution list for periodic updates or to ask questions about the project.
The State of the Map 2016

Recently graduated Geothink student Julia Conzon (McGill University) has recently returned from the State of the Map conference in Brussels, on a travel grant. Julia was able to meet individuals interested in different social, political, and technical components of OpenStreetMap, which solidified her beliefs that the success of volunteered geographic information relies on both social and technical fields. Julia’s interests in mapping include: increasing diversity to reduce the digital divide and harnessing government support.

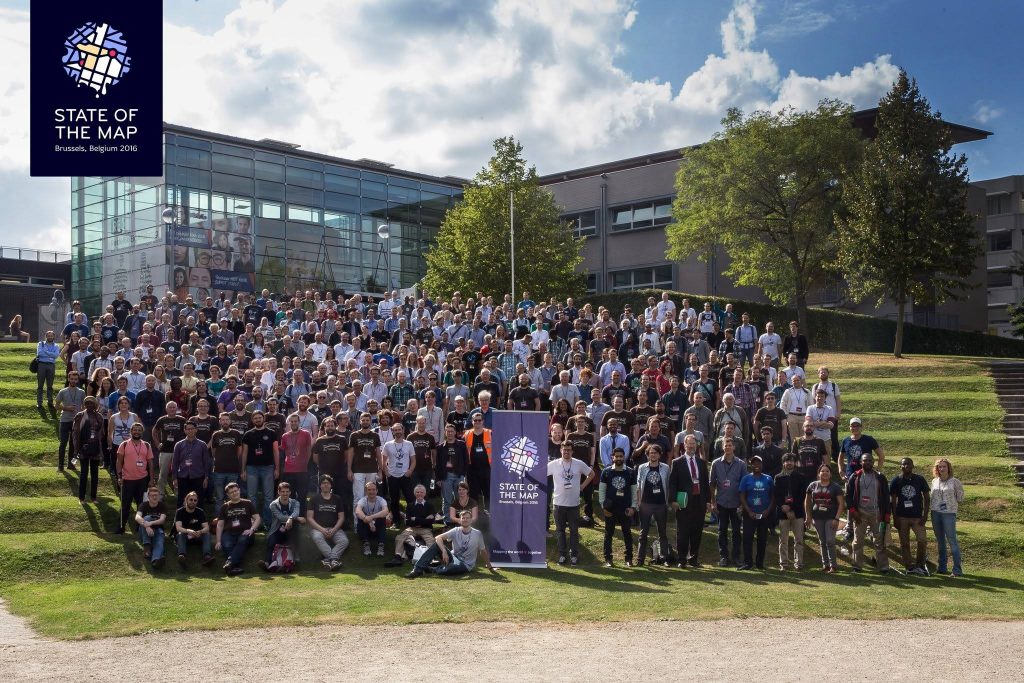
SOTM group photo (photo by Tatiana Van Campenhout)

SOTM group photo (photo by Tatiana Van Campenhout)

By Julia Conzon

I recently attended the State of the Map (SOTM) in Brussels, Belgium. SOTM is a conference that discusses various social, political, and technical components of OpenStreetMap (OSM), a mapping website that aims to map all of Earth’s landscapes, such as social and physical infrastructures. You may wonder, doesn’t Google already do this? In short, yes, Google has done an efficient job producing Google Maps and its associated routing/navigation software; but it still has its limitations. First, Google Maps has several unmapped locations. As addressed by SOTM’s keynote speaker Allan Mustard, US Ambassador to Turkmenistan, if you compare the map of Ashgabat, Turkmenistan, between Google Maps and OSM, you will certainly see a difference (Figure 1). Secondly, Google’s spatial data is not open, which hampers equality and empowerment. Thanks to Ambassador Mustard’s initiative to use OSM, he and several Ashgabat locals have mapped out the remote city and now the citizens can use this open spatial data for various socio-economic purposes. For example, prior to the OSM maps, Ashgabat taxi drivers did not know where all the gas stations were located. Now, with a local map openly accessible to all citizens, Ambassador Mustard says taxi drivers are more efficient at navigation. In short, OSM provides an open-source platform that allows worldwide internet users to contribute geographic features of anywhere from anywhere, which then can be freely downloaded by anyone to use.

Figure 1. Differences in Ashgabat, Turkmenistan between OSM (left) and Google Maps (right) (screenshots from OSM and Google Maps)

Figure 1. Differences in Ashgabat between OSM (left) and Google Maps (right) (screenshots from OSM and Google Maps)

Government Support
As seen with Ambassador Mustard, there are some within government who do support crowdsourced mapping initiatives. With Federal funding, Statistics Canada has announced a pilot crowdsourcing project starting in October 2016 to use OSM’s platform to crowdsource building data. It was also exciting to see the government presence at the conference (such as a member of Statistics Canada) and government partnerships such as between Etalab (a French government organisation) and OSM France.

Through one of the Birds of a Feather (BoF) discussions I participated in, it is apparent that OSM’s platform is positively reshaping certain government’s perceptions on how to produce open data. However, a presentation from Usman Latif, a journalist from Pakistan and the founder of Open Humanitarians (formerly DigitalHumanitarians.pk), reminded the SOTM audience that not all governments are democratizing their data. In Pakistan, broad laws have made unauthorised mapping activities by locals illegal. Usman risks penalties if he encourages local mapping, but he explained that to follow the law, he encourages students and youth to map parts of the world outside Pakistan and “to be a part of a global humanitarian society.” Usman’s goal is to proliferate a vibrant community of humanitarian mappers in Pakistan who can eventually use their mapping skills to participate in the global humanitarian society, particularly in disaster response. With Pakistan prone to earthquakes and floods, Usman hopes these educated Pakistanis will contribute to domestic disaster responses once Pakistan opens up local mapping. With this mindset, Usman now educates university students in Pakistan on using OSM. Although not all governments are supportive of open spatial data, Usman’s goals illustrate how educating locals about OSM and encouraging them to contribute to global (digital) humanitarian society can promote local empowerment, something I believe is a worthwhile alternative.

Smart Cities
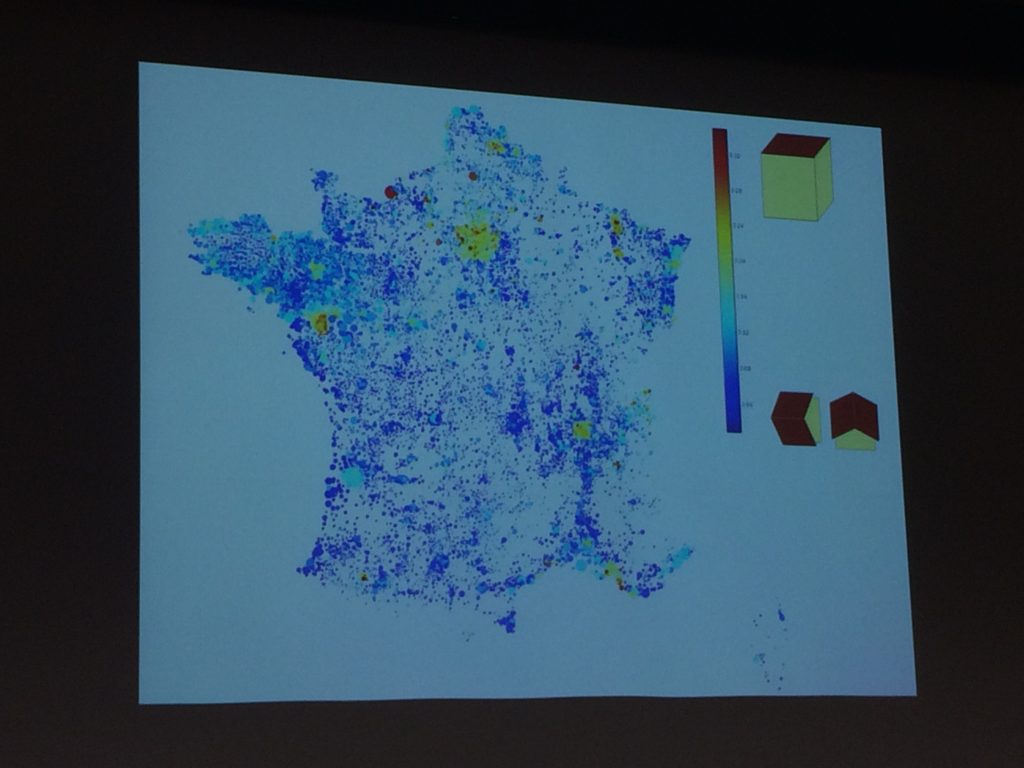
Apart from social and political components of OSM, many presentations also addressed technical components; more specifically, new automated tools for OSM users. Some of these tools can be used to promote smart cities. Christian Quest and Michel Blancard from Etalab presented OpenSolarMap (view Figure 2). This presentation discussed using machine learning to identify which rooftops throughout France are most suitable for solar panel instalment based on rooftop aspect direction (north, south, west, east, or flat). Although there are still some variables that are excluded (e.g., solar intensity or rooftop angle), the software does highlight a more efficient methodology.

etalab-visualisation

Figure 2. Etalab’s map visualization of rooftop directions (photo by Julia Conzon).

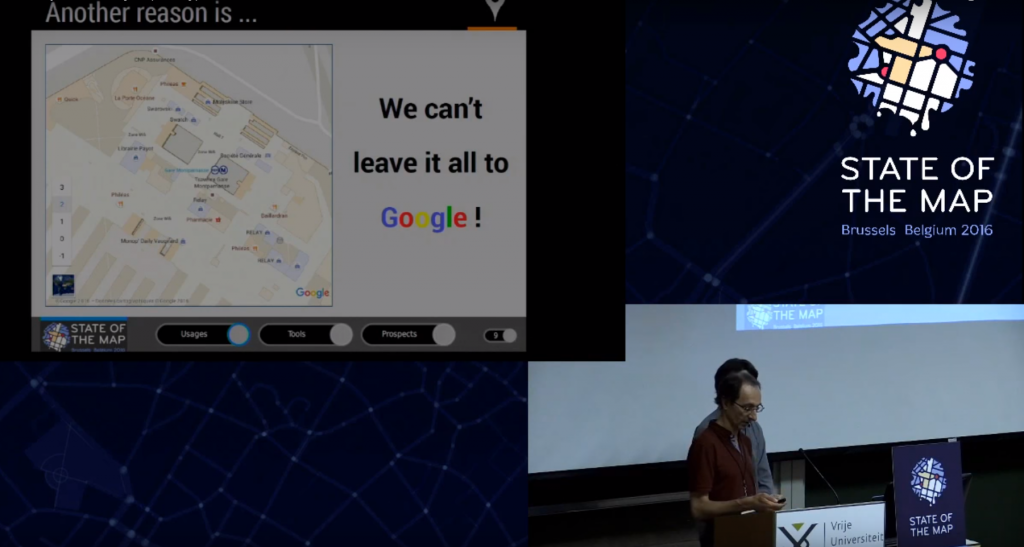
There were also three presentations proposing different methods to map indoor areas. Indoor data can be used for a series of smart city applications, such as geomarketing. For instance, a mobile app could link indoor routing with a store’s product information to direct a customer to the product they want in the store while also encouraging them to pass by other similar products. Although each presentation proposed slightly different methodologies to map out indoor areas, all three shared similar concerns on mapping certain features, such as whether a stairway takes you up or down a floor. There were also different stances on opening up the indoor data to the public. For example, French National Railway Company (SNCF) have mapped the interiors of all popular stations in Paris; but, instead of this data being openly accessible to the public, they combined their data with OSM data to create an app that provides maps of these stations’ interiors. Unfortunately, this app is not available for free, which disappointed myself and my neighbouring audience members. On the other hand, Roland Olbricht’s and Roland Wagner’s workshop taught the audience how to map building interiors with OpenStationMap, which is an OSM project that aims to incorporate indoor mapping onto OSM’s station polygons. As Google Maps has also introduced indoor mapping, Carto Cité’s presentation on indoor mapping reminded the audience, ‘We can’t leave it all to Google’ (Figure 3). If we leave indoor mapping to a few corporations, data accessibility may be restricted for commercial interests.

Figure 3. Indoor mapping efforts should not be undertaken by only a few actors

Figure 3. Indoor mapping efforts should not be undertaken by only a few actors (screenshot from YouTube)

Conclusion
Overall, the State of the Map presented two trends: collaborative learning and machine learning. The latter trend reflects discussions on automation of mapping processes, while the former trend reflects discussions on on-the-ground mapping with locals. Although these trends seem diverging, OSM’s platform is capable of incorporating both. As OSM Foundation’s Mikel Maron mentioned, it is about being “a part of the database.” Whether it be building technical tools to ease mapping complex areas or educating locals to contribute geospatial data, both trends aim to provide open geospatial data for all to use.

This collaborative environment has ultimately encouraged me to sustain the initiative for open spatial data. With the knowledge I have gained from the conference, I will introduce several new activities to Maptime MTL. Feel free to contact me at juliaconzon@gmail.com or maptimemtl@gmail.com if you are interested in participating or collaborating. You can also connect with me on Twitter @julconz and LinkedIn.

GIS & the Global Community: Humanitarian Mapping

Image of KLL team on balcony of new headquarters

KLL team outside their new headquarters. Photo courtesy Kathmandu Living Labs.

By Naomi Bloch


Today, November 18, marks the 16th annual GIS Day. Throughout the week, Geothink has been presenting a series of posts looking at some of the ways in which our collaborators, partners, and friends around the world are critically examining and using GIS as a tool for civic engagement and understanding.
The community snapshots presented this week highlight diverse perspectives and uses for GIS. We conclude our series with the following piece on humanitarian mapping and OpenStreetMap.

This past March, Nama Budhathoki, a long-time contributor to OpenStreetMap, announced his candidacy for the Humanitarian OpenStreetMap Team (HOT) Board of Directors. Budhathoki, the executive director of Nepal’s Kathmandu Living Labs (KLL), posted a manifesto that — in the months following Nepal’s April 25 earthquake — seemed beyond prescient. In it, he proposed his vision for HOT, and for the crowdsourced mapping community around the world.

Budhathoki’s principal message is two-fold. 1) Humanitarian mapping can be more effective by transitioning from being primarily a reactive community to one that encourages mapping communities to develop where they’re most needed — before crisis strikes. 2) A unique benefit of crowdsourced mapping stems from its role in community engagement and capacity building.

OpenStreetMap’s U.S. Chapter is a Geothink partner. Geothink recently caught up with Budhathoki while he was visiting Washington D.C. as the invited featured speaker at the launch of Mapping for Resilience: Turning Data into Decisions, a new program that aims to support geospatial data development in areas of need using OpenStreetMap.

Mapping as civic engagement

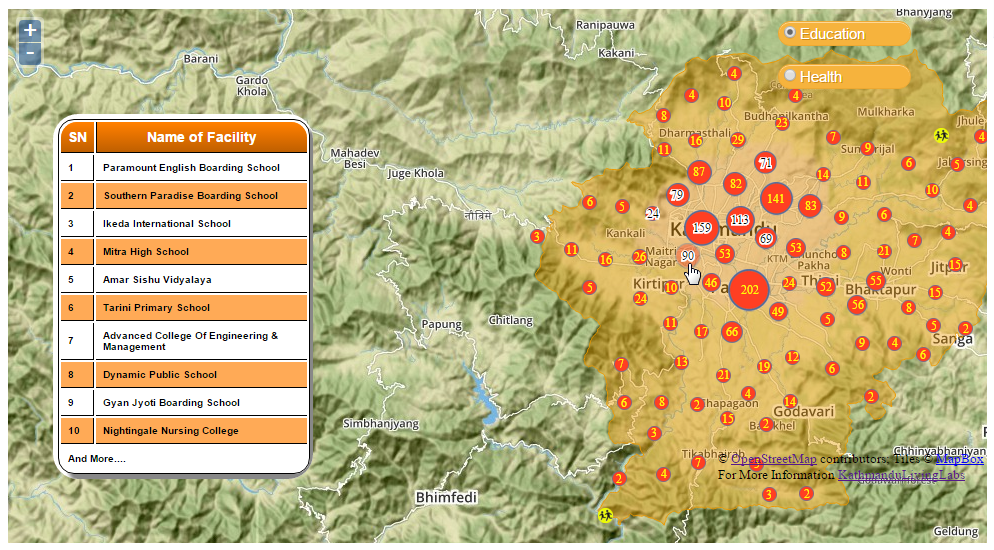
The challenge that KLL has been addressing for several years now in Kathmandu is the lack of decent spatial data and maps for the region. The small team has been tackling the problem by collaborating with educational institutions in Nepal, training students how to map their local environment in OpenStreetMap. In 2013, for example, they went out into the field to collect exposure data at the individual building level for over 2,000 schools, colleges and universities, as well as 350 health facilities in Kathmandu Valley. They mapped this data on OpenStreetMap so that the information could be downloaded and used by government and other organizations developing risk assessments and plans.

For Budhathoki, the act of mapping is a mechanism for engaging citizens and building local knowledge and awareness. “I keep emphasizing this, but I can’t stress it enough. Mapping is not just about the final product — you know, the map itself. The act of mapping is important; it’s about engaging the community,” Budhathoki said. “In the process of conducting these activities, you are talking to people in the community, sensitizing them to the issues, preparing them in advance to think about it.”

Budhathoki notes that one of the most important reasons to have active, capable mapping communities on the ground in high-risk regions is so that they can build trust within their communities before disaster strikes. “KLL has been working with the government, working with organizations in the community, and with different aid organizations for several years,” Budhathoki said. “So when the earthquake hit, we not only had the local knowledge and the capacity so that we could open the situation room within 24 hours of the earthquake, but we also had the trust of all these organizations. In my experience, this element of trust is very important.”

Mobilizing the global community

Within 48 hours following the first earthquake, over 1,500 mappers around the world had responded to the call to support Nepal. Kathmandu Living Labs coordinated the effort together with HOT. This October, KLL posted a timeline capturing the milestones of their six-month journey since April.

As is typically the case on crowdsourced projects, while some contributors signed on only briefly, other mappers dedicated themselves to the cause. These core mappers, Budhathoki believes, tended to be those with a longer history on OSM and HOT projects, because they typically have a better understanding of the types of commitments and challenges involved.

“In principle, because OSM is a crowdsourcing geo platform, it is by definition designed to have a low barrier to entry,” Budhathoki explained. “Anyone should be able to begin mapping. That’s in principle. But in reality, there are tasks that require more knowledge. So for example, users with more OpenStreetMap experience handle validation tasks.

“GIS experts anywhere in the world should be able to adapt to the OpenStreetMap environment even if it is new for them. For GIS experts, OSM is a pretty simple tool, generally. They can contribute expertise that is useful, that contributes to quality of the information. But not everyone is comfortable in a crowdsourced environment.”

Where local meets global

Geothink co-applicant Claus Rinner, a professor and chair of Ryerson University’s Department of Geography and Environmental Studies, coordinated several Mapping for Nepal workshops in Toronto after the first quake struck. Rinner worked with a group of students with varying degrees of mapping experience as well as local GIS professionals to help map the affected areas. Following his experiences, he posted some reflections regarding the current slippery boundaries between traditional GIS and OpenStreetMap as a crowdsourced mapping platform — and highlighted the need for more formal education opportunities that incorporate OSM as a tool. More recently, Rinner noted that high school students have been expressing an interest in Ryerson’s mapping events for Nepal. “My main observation here is that OSM/HOT mapping is a type of community activity that uses the students’ study-related expertise,” Rinner said, “rather than being something that anyone could do.”

Budhathoki sees the work of the global OSM community as valuable on a number of levels, but also highlights the importance of local knowledge. “Virtual mappers without advanced knowledge can do fundamental tasks like mapping the road network,” Budhathoki said, “but then who can provide the name of the road? It’s the local community. And different countries categorize roads differently, so it is difficult to know what road is a highway, for example. You can’t just assume this based on the width of the road.

“So, local understanding is always going to be important — particularly in these situations, where the information is needed by humanitarian organizations and is being used on the ground right away.”

If you have any questions for Nama or the KLL team, you can reach them on Twitter here: @KTMLivingLabs

To get a quick sense of KLL and OSM’s work in Nepal since April, check out the Kathmandu Living Labs: Six-Months of Earthquake Response timeline.


If you have thoughts or questions about this article, get in touch with Naomi Bloch, Geothink’s digital journalist, at naomi.bloch2@gmail.com.