Tag Archives: National Household Survey

Moving Forward with Canadian Census Data

By Naomi Bloch


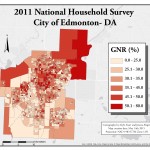
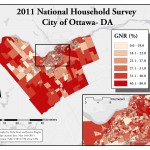
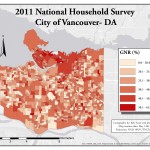
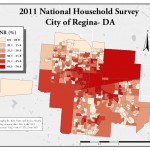
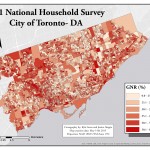
Chloropleth maps of National Household Survey global non-response data at the dissemination-area level courtesy Scott Bell. Global non-response rates > 50% resulted in suppression of data for that spatial unit. All maps are classified using a quantile classification scheme.


As we move forward (and backward) with the 2016 return of Canada’s long-form census, questions remain for everyone who uses Statistics Canada’s key socio-economic data. Researchers, local government agencies, community organizations, and industry will still need to use data collected via the 2011 National Household Survey and understand how to reconcile that information with long-form census data.

Concerns regarding the reliability of NHS data stem from the lower response rates that resulted from the non-mandatory nature of the 2011 survey. The overall response rate for the survey decreased from 94 percent in 2006 to 69 percent in 2011. Media attention has centred on the fact that Statistics Canada chose not to release survey data for 25 percent of all census subdivisions because response rates for those spatial units were too low. A key question is whether the regions for which we have no reliable data share certain socio-economic characteristics — and if so, how this might impact service provision.

Geothink co-applicant researcher Scott Bell, a professor of Geography and Planning at University of Saskatchewan, has been studying and mapping the spatial patterns of the National Household Survey’s global non-response rates. His work examines various geographic levels, and considers response rate patterns relative to several socio-economic variables. Bell found that across the 15 cities he studied, there are many commonalities between areas where response rates are similar.

In this video interview, Bell discusses his research and its implications.

For more from Scott Bell, see also: The Long-term Impacts of the Short-Lived National Household Survey

If you have thoughts or questions about this video interview, get in touch with Naomi Bloch, Geothink’s digital journalist, at naomi.bloch2@gmail.com.
The Long-term Impacts of the Short-lived National Household Survey

Tweet

By Naomi Bloch

On November 5, Navdeep Bains, Canada’s new Minister of Innovation, Science and Economic Development (now that’s a mouthful!) confirmed the rumours that the country’s mandatory long-form census will be reinstated in 2016.

But what are the long-term consequences of the interruption in mandatory data collection caused by 2011’s National Household Survey (NHS)? How significant is this short-lived census change likely to be?

Geothink co-applicant researcher Scott Bell, a professor of Geography and Planning at University of Saskatchewan, has been studying and mapping the spatial patterns of the voluntary National Household Survey data, comparing global non-response rates in metropolitan and non-metropolitan areas across the country. After today’s official announcement, Bell shared a few preliminary thoughts based on his research.

profile photo of Scott Bell

Scott Bell is a professor in the Department of Geography and Planning at the University of Saskatchewan.

Geothink: Now that the mandatory long-form census has been re-instated, is there anything that researchers or others who rely on location-based specifics from census data need to keep mind?

Scott Bell: In my own research I have been relying on 2006 data for much longer than I would have if the 2011 survey had been the long form of the census. The NHS misrepresents different parts (and types of parts) of the country. In my analysis of 15 Canadian cities, there were lower response rates (measured by non-response) in places with low income, aboriginal populations, new immigrants, and lower rates of education. This is quite troubling since the only solution Stats Canada had at their disposal was over sampling in such areas, which might exacerbate the bias.

Geothink: Did you find that your own recent research was impacted by the 2011 data, and are there likely to be any long-term implications for researchers, given that just one survey period was affected?

Scott Bell: Yes, I was compelled to use long-form data from 2006. It is a relief that we will have a return of this data for 2016. I have always appreciated Canada’s five-year census cycle and a 10-year wait is going to be OK, this once. But there will be a persistent problem trying to understand our society between 2011 and 2016 that won’t be true of another five-year period. Our understanding of economics, household mobility, finances, and structure, immigration, education, etc. for the period from 2011 to 2016 is diminished.

Geothink: Are there any important considerations to keep in mind, for those integrating data from 2011 and other periods?

Scott Bell: In work I hope to publish in the next six months, patterns of response (actually non-response) and what social and economic variables predict this non-response will be elucidated. The next step might be the development of tools to adjust NHS values in order to make the data collected more reliable. The most important step in this direction will be the collection of the long form in 2016; that data will be useful in establishing estimates of what 2011 values are valid and perhaps allow for the setting of “correction factors” for egregious rates of non-response.

Stay tuned for more detailed insights from Scott Bell on location-specific considerations of the National Household Survey data, coming soon to Geothink.ca.

If you have thoughts or questions about this article, get in touch with Naomi Bloch, Geothink’s digital journalist, at naomi.bloch2@gmail.com.