Tag Archives: crowdmap

The State of the Map 2016

Recently graduated Geothink student Julia Conzon (McGill University) has recently returned from the State of the Map conference in Brussels, on a travel grant. Julia was able to meet individuals interested in different social, political, and technical components of OpenStreetMap, which solidified her beliefs that the success of volunteered geographic information relies on both social and technical fields. Julia’s interests in mapping include: increasing diversity to reduce the digital divide and harnessing government support.
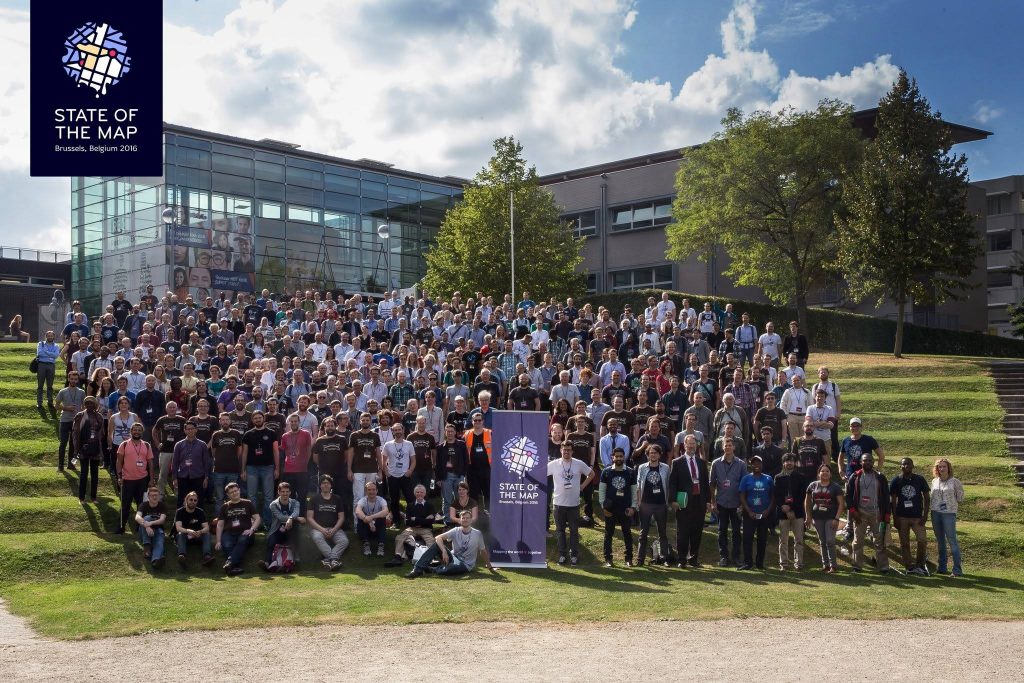
SOTM group photo (photo by Tatiana Van Campenhout)

SOTM group photo (photo by Tatiana Van Campenhout)

By Julia Conzon

I recently attended the State of the Map (SOTM) in Brussels, Belgium. SOTM is a conference that discusses various social, political, and technical components of OpenStreetMap (OSM), a mapping website that aims to map all of Earth’s landscapes, such as social and physical infrastructures. You may wonder, doesn’t Google already do this? In short, yes, Google has done an efficient job producing Google Maps and its associated routing/navigation software; but it still has its limitations. First, Google Maps has several unmapped locations. As addressed by SOTM’s keynote speaker Allan Mustard, US Ambassador to Turkmenistan, if you compare the map of Ashgabat, Turkmenistan, between Google Maps and OSM, you will certainly see a difference (Figure 1). Secondly, Google’s spatial data is not open, which hampers equality and empowerment. Thanks to Ambassador Mustard’s initiative to use OSM, he and several Ashgabat locals have mapped out the remote city and now the citizens can use this open spatial data for various socio-economic purposes. For example, prior to the OSM maps, Ashgabat taxi drivers did not know where all the gas stations were located. Now, with a local map openly accessible to all citizens, Ambassador Mustard says taxi drivers are more efficient at navigation. In short, OSM provides an open-source platform that allows worldwide internet users to contribute geographic features of anywhere from anywhere, which then can be freely downloaded by anyone to use.

Figure 1. Differences in Ashgabat, Turkmenistan between OSM (left) and Google Maps (right) (screenshots from OSM and Google Maps)

Figure 1. Differences in Ashgabat between OSM (left) and Google Maps (right) (screenshots from OSM and Google Maps)

Government Support
As seen with Ambassador Mustard, there are some within government who do support crowdsourced mapping initiatives. With Federal funding, Statistics Canada has announced a pilot crowdsourcing project starting in October 2016 to use OSM’s platform to crowdsource building data. It was also exciting to see the government presence at the conference (such as a member of Statistics Canada) and government partnerships such as between Etalab (a French government organisation) and OSM France.

Through one of the Birds of a Feather (BoF) discussions I participated in, it is apparent that OSM’s platform is positively reshaping certain government’s perceptions on how to produce open data. However, a presentation from Usman Latif, a journalist from Pakistan and the founder of Open Humanitarians (formerly DigitalHumanitarians.pk), reminded the SOTM audience that not all governments are democratizing their data. In Pakistan, broad laws have made unauthorised mapping activities by locals illegal. Usman risks penalties if he encourages local mapping, but he explained that to follow the law, he encourages students and youth to map parts of the world outside Pakistan and “to be a part of a global humanitarian society.” Usman’s goal is to proliferate a vibrant community of humanitarian mappers in Pakistan who can eventually use their mapping skills to participate in the global humanitarian society, particularly in disaster response. With Pakistan prone to earthquakes and floods, Usman hopes these educated Pakistanis will contribute to domestic disaster responses once Pakistan opens up local mapping. With this mindset, Usman now educates university students in Pakistan on using OSM. Although not all governments are supportive of open spatial data, Usman’s goals illustrate how educating locals about OSM and encouraging them to contribute to global (digital) humanitarian society can promote local empowerment, something I believe is a worthwhile alternative.

Smart Cities
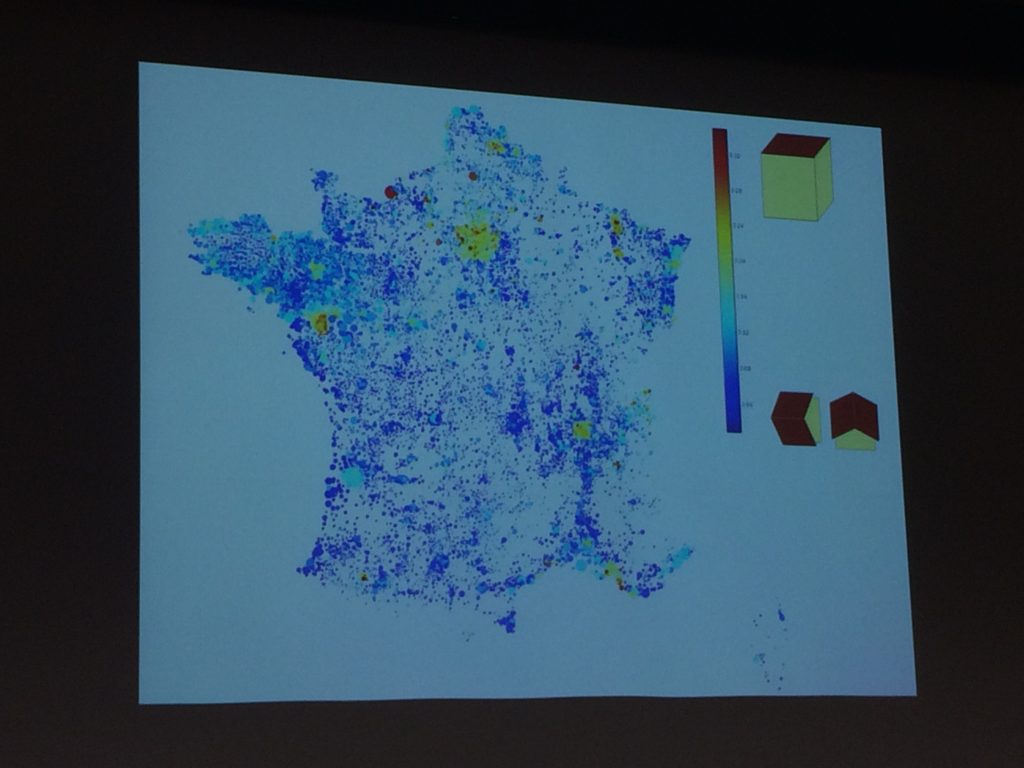
Apart from social and political components of OSM, many presentations also addressed technical components; more specifically, new automated tools for OSM users. Some of these tools can be used to promote smart cities. Christian Quest and Michel Blancard from Etalab presented OpenSolarMap (view Figure 2). This presentation discussed using machine learning to identify which rooftops throughout France are most suitable for solar panel instalment based on rooftop aspect direction (north, south, west, east, or flat). Although there are still some variables that are excluded (e.g., solar intensity or rooftop angle), the software does highlight a more efficient methodology.

etalab-visualisation

Figure 2. Etalab’s map visualization of rooftop directions (photo by Julia Conzon).

There were also three presentations proposing different methods to map indoor areas. Indoor data can be used for a series of smart city applications, such as geomarketing. For instance, a mobile app could link indoor routing with a store’s product information to direct a customer to the product they want in the store while also encouraging them to pass by other similar products. Although each presentation proposed slightly different methodologies to map out indoor areas, all three shared similar concerns on mapping certain features, such as whether a stairway takes you up or down a floor. There were also different stances on opening up the indoor data to the public. For example, French National Railway Company (SNCF) have mapped the interiors of all popular stations in Paris; but, instead of this data being openly accessible to the public, they combined their data with OSM data to create an app that provides maps of these stations’ interiors. Unfortunately, this app is not available for free, which disappointed myself and my neighbouring audience members. On the other hand, Roland Olbricht’s and Roland Wagner’s workshop taught the audience how to map building interiors with OpenStationMap, which is an OSM project that aims to incorporate indoor mapping onto OSM’s station polygons. As Google Maps has also introduced indoor mapping, Carto Cité’s presentation on indoor mapping reminded the audience, ‘We can’t leave it all to Google’ (Figure 3). If we leave indoor mapping to a few corporations, data accessibility may be restricted for commercial interests.
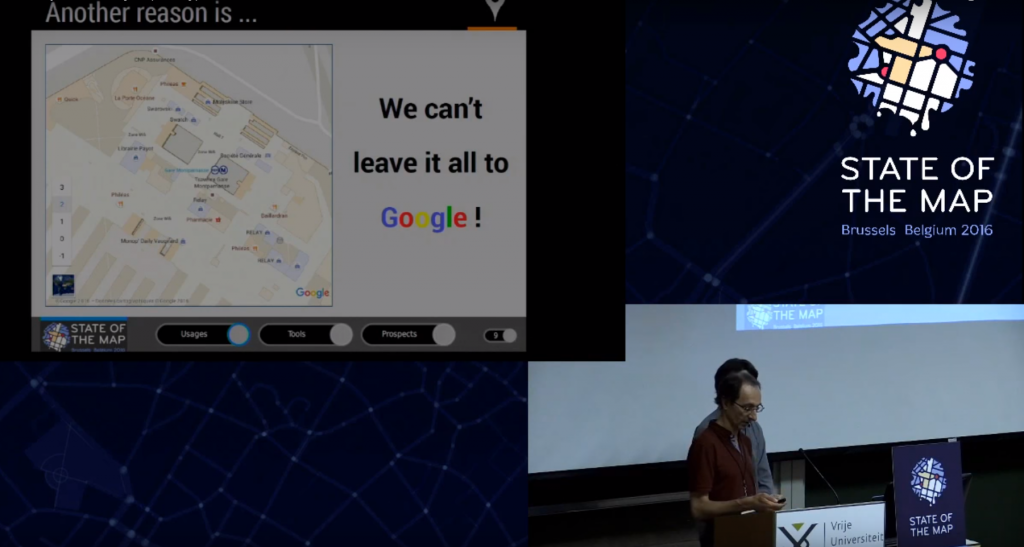
Figure 3. Indoor mapping efforts should not be undertaken by only a few actors

Figure 3. Indoor mapping efforts should not be undertaken by only a few actors (screenshot from YouTube)

Conclusion
Overall, the State of the Map presented two trends: collaborative learning and machine learning. The latter trend reflects discussions on automation of mapping processes, while the former trend reflects discussions on on-the-ground mapping with locals. Although these trends seem diverging, OSM’s platform is capable of incorporating both. As OSM Foundation’s Mikel Maron mentioned, it is about being “a part of the database.” Whether it be building technical tools to ease mapping complex areas or educating locals to contribute geospatial data, both trends aim to provide open geospatial data for all to use.

This collaborative environment has ultimately encouraged me to sustain the initiative for open spatial data. With the knowledge I have gained from the conference, I will introduce several new activities to Maptime MTL. Feel free to contact me at juliaconzon@gmail.com or maptimemtl@gmail.com if you are interested in participating or collaborating. You can also connect with me on Twitter @julconz and LinkedIn.
Mapping Inclusive Employment: Community Engagement on the Participatory Geoweb

Project partners exploring the interactive map

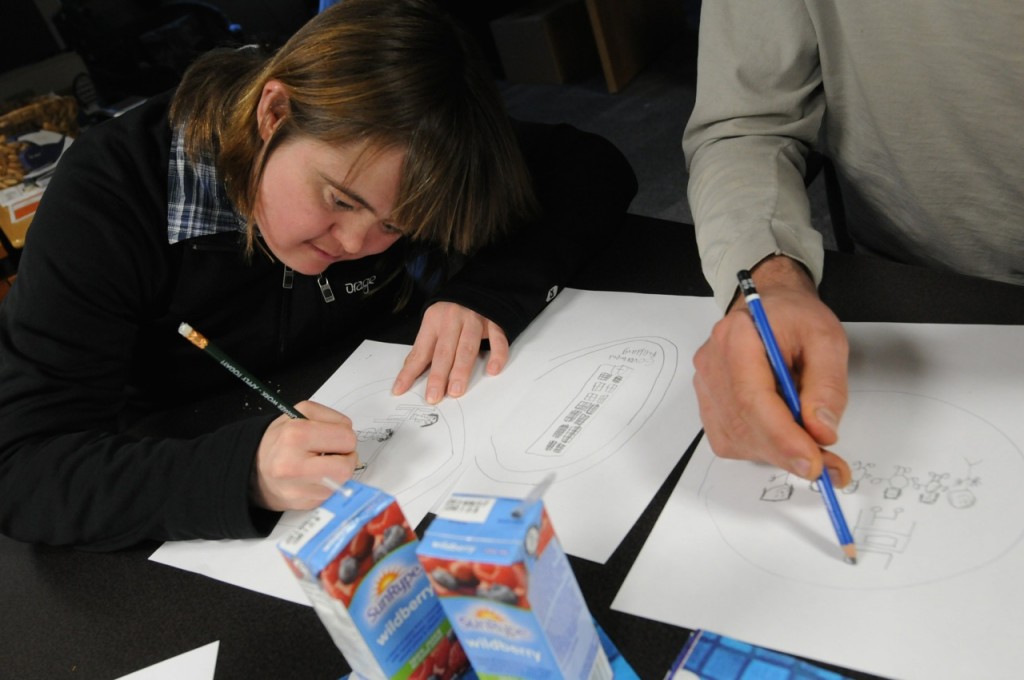
Participants were asked to draw pictures representing the five stakeholder groups. The drawings formed the basis for the icons used on the map markers. Photo courtesy the SpICE Lab (Spatial Information for Community Engagement)


By Naomi Bloch

In British Columbia, researchers have been using a crowdsourced mapping tool to capture positive employment experiences of individuals with intellectual disabilities. Geothink co-applicant Jon Corbett, an associate professor at the University of British Columbia’s Okanagan campus, is one of several UBC contributors to the participatory research project. Recently, the group published findings from its two-year pilot program.

The project is a collaboration between government agencies, the University of British Columbia, as well as self-advocates with intellectual disabilities and community partners. It demonstrates how government and citizens can employ the geoweb and participatory mapping to address community issues. “What we wanted to do specifically,” said Corbett, “was create a crowdsourced tool that would enable people to share their positive experiences, so that other people with intellectual disabilities and their family members and employers and also service providers could come to the site and they could actually see examples of positive employment. And so then they could emulate that, and they could strategize around that.”

This required developing an online environment that could engage all the identified stakeholder groups. To accomplish this, the initiative turned to the GeoLive participatory mapping tool, developed by Corbett’s Spatial Information for Community Engagement (SpICE) Lab. The GeoLive platform is a key component of a number of Geothink partner projects.

According to Corbett, GeoLive was initially conceived as a means to better support excluded and marginalized populations. “We know that when we share information on the cloud we have no idea how that information will be re-purposed, re-used, or stored,” Corbett said. “It can reappear in ways where we might least expect it in the future. So we wanted to get away from that and provide a certain level of guarantee that the information that people shared through the map is actually uniquely stored on our own servers, and should they wish to delete it they can delete it and it will be deleted forever.”

Corbett and GeoLive programmer Nick Blackwell are able to work directly with community members to customize the platform based on user needs. The software, which is built around the familiar Google Maps API,  is now used both by community groups as well as academic researchers. In the process of working with their inclusive employment partners, Corbett and his colleagues gained new insights regarding some of the usability challenges on the participatory geoweb. These included spatial literacy issues, the need to make the platform more mobile-friendly and less reliant on keyboard interaction, as well as accommodating users who have limited familiarity with today’s social media conventions.

Self advocates with intellectual disabilities and other stakeholders collaborated with Corbett’s team to design, evaluate, and further customize the online mapping tool. The group then worked with individuals and organizations throughout the province to collect stories of successful and inclusive employment. Over eighty narratives are now included on the map. While some markers have simple text descriptions, others include video, audio, as well as photos.

The map now serves as a shared space for community engagement. At the same time, university researchers associated with the project have been able to analyze the collected stories to identify some of the common features described in participants’ positive employment experiences. Map contributors discuss issues such as the challenges of finding a job, as well as the social and practical factors that create an enriching work environment. These findings are expected to help inform best practice guidelines that can support employment services for people with intellectual disabilities in the future.

The map is now public, and anyone can contribute their own relevant experiences or explore other people’s stories at http://www.mappinginclusiveemployment.ca/.

Reference: Hole, R., Corbett, J., Cook, S., & de Raaf, S. (2015). Mapping inclusive employment practices for individuals with developmental disabilities: A participatory research mapping project. The BC Centre for Employment Excellence, 32 pages.

If you have thoughts or questions about this article, get in touch with Naomi Bloch, Geothink’s digital journalist, at naomi.bloch2@gmail.com.

Twitter Chat: Civic Participation on the Geoweb

We Grow Food Trading Table ...   #FoodisFree #WeGrowFood

For her Ph.D. research, Victoria Fast explored how urban food assets can be crowdsourced onto the geoweb — civic participation in action.

All cylinders were firing by the time we wrapped up our Nov. 23 Twitter chat on meaningful civic participation on the geoweb. There were many parallel conversations that we hope will continue among participants and the wider Geothink community into the future. Here we share a few highlights, as well as a transcript of the chat.

  • We should ask what criteria define “civic participation”? Even passive or unknowing involvement may qualify as meaningful participation.
  • Intermediaries (infomediaries) are major mediators of the geoweb — leading projects, supporting learning, and providing citizens with tools and open data access. Librarians were identified as important infomediaries.
  • The geoweb can enable citizen participation on all levels of ‘meaning’. Yet we need to be mindful of who is being left out & not blame the excluded.
  • There can be different benefits from short-term engagements such as hackathons and long-term involvement such as contributing to OpenStreetMap. But both can trigger enduring civic interest.
  • It can be useful to consider when geoweb contributions using open data do not qualify as civic participation.
  • Both time-decay (sustainability) and distance-decay (activities concentrating around intermediary’s location) are issues that can affect civic participation on the geoweb.

Transcript


Spotlight on Recent Publications: Exploring the Hyperbole Behind Crisis Mapping Through Chronic Community Development Issues

By Drew Bush

McGill University Masters Student Ana Brandusescu, lead author on the paper "Confronting the hype: The use of crisis mapping for community development."

McGill University Masters Student Ana Brandusescu, lead author on the paper “Confronting the hype: The use of crisis mapping for community development.”

In a paper published this month, Geothink researchers critically examined the role that crisis mapping software such as Crowdmap can play when used to instead facilitate development issues in three Canadian communities in Vancouver and Montreal. They argue that such platforms hold many technological constraints, including an intrinsic short-term feel that makes it difficult to deploy on the chronic, long-term issues common to community development.

Entitled “Confronting the hype: The use of crisis mapping for community development,” the paper was published in Convergence: The International Journal of Research into New Media Technologies by McGill University Masters Student Ana Brandusescu and Associate Professor Renee Sieber along with Université du Quebec à Montréal Professor Sylvie Jochems. Please find the abstract below.

Each of the case studies examined in the paper involved a different set of circumstances. In Montreal, the researchers worked with a community of low-income immigrants in single-family homes who predominantly spoke French. In contrast, one community in Vancouver consisted of young middle-class families living in subsidized student housing while the other was an ethnically diverse low-income community living in rented housing. Both Vancouver communities predominantly spoke English.

“The Vancouver cases had issues resembling crises, for example, immediate rezoning, antidensification, and loss of social housing,” the researchers wrote in the paper. “The Montreal organizers wished to address longer term issues like the recording of community assets.”

In each community, the researchers prepared participants at initial community meetings by using storyboards or comic books to explain the process of mapping. Furthermore, a manual they created helped application managers and community members understand how to manage the application, submit reports (via texts, tweets, Web reports, e-mails and smartphone message), geolocate reports, and handle messages that might contain personal identifiers or foul language. In Vancouver, the managers consisted of community activists while in the Montreal case the managers were part-time professional community organizers.

Although each community differed in their implementation of the mapping software and program, the findings were striking.

“In this article, we explored the reality behind the hype of crisis mapping and revealed that hype through its repurposing to community development,” they write in their conclusion. “We confronted the zero-cost argument and found numerous technology constraints, which confirmed the challenges of introducing a new technological medium to community development processes.”

“Burns asserted that knowledge politics concerns the role of power in developing a map but the politics also refers to the overall hype to which we so easily succumb,” they add later in their conclusion in reference to a paper by a researcher at the University of Washington, Ryan Burns, entitled Moments of closure in the knowledge politics of digital humanitarianism. “If we acknowledge and then work past the hype then perhaps we will achieve more meaningful and sustainable systems.”

Abstract
Confronting the hype: The use of crisis mapping for community development
This article explores the hyperbole behind crisis mapping as it extends into more long term or ‘chronic’ community development practices. We critically examined developer issues and participant (i.e. community organization) usage within the context of local communities. We repurposed the predominant crisis mapping platform Crowdmap for three cases of community development in Canadian anglophone and francophone. Our case studies show mixed results about the actual cost of deployment, the results of disintermediation, and local context with the mapping application. Lastly, we discuss the relationship of hype, temporality, and community development as expressed in our cases.

If you have thoughts or questions about the article, get in touch with Drew Bush, Geothink’s digital journalist, at drew.bush@mail.mcgill.ca.