Tag Archives: smart cities

Can Citizen Science Help Cities Address Climate Change?

Photo of people taking noise level readings.

Mapping for Change supports citizen science inquiries into environmental and social issues. Here, participants take noise level readings in regions around a London airport. Photo courtesy Mapping for Change.

By Naomi Bloch

If you were following the recent climate change talks in Paris, you may have noticed a recurring theme: policymakers acknowledging the leadership of subnational governments in addressing climate change. Canada’s own delegation to the conference included representatives from the Canadian Federation of Municipalities, as well as provincial and indigenous leaders.

While the 2015 United Nations Climate Change Conference focused on political negotiations, critics have been quick to remind legislators that more efforts are needed to involve citizens in decision-making. It’s hardly a new idea, but how can civic participation function at a global scale? Activities at the local level may hold the key. Municipalities often have established mechanisms to involve the public in deliberative activities. Cities and their citizens can also collaborate on the evidence-gathering needed to make informed decisions.

Geothink collaborator Muki Haklay is the director of the University College London’s Extreme Citizen Science group and a professor of Geographic Information Science in the Department of Civil, Environmental and Geomatic Engineering. In 2008, he co-founded Mapping for Change, an organization that uses participatory mapping and citizen science to address environmental and social issues in cities.

Headshot of Muki Haklay

Muki Haklay, professor of Geographic Information Science in the Department of Civil, Environmental and Geomatic Engineering, University College London.

“I see the value of citizen science as part of wider environmental democracy, going back to the Rio conference in 1992,” Haklay explained in an email interview with Geothink. Principle 10 of the Rio Declaration on Environment and Development states that, at national levels, citizens should have “appropriate access to information concerning the environment that is held by public authorities, including information on hazardous materials and activities.” At the community level, the Declaration calls for active and informed public participation in environmental decision-making processes.

Citizen science invites non-professionals to participate in data gathering and the production of new scientific knowledge. “I see citizen science as a new part of the picture,” said Haklay, “where people also participate in creating environmental information that will influence their lives.”

In Haklay’s view, citizen science has particular benefits that can complement traditional research. “The various changes that have occurred in society and technology mean that we can open environmental decision-making further and make it more inclusive and participatory.” As with all research, appropriate rigor and attention to methodology are required. “Not all data should come from citizen science,” said Haklay. “In terms of data quality, citizen science requires us to use appropriate quality assurance methods.”

Mapping for Change provides some helpful exemplars. One collaboration with local organizations has seen thirty different communities across London measuring and mapping air quality data for their neighbourhoods. “We used a whole range of methods: wipe samples, where we checked for heavy metals in dust on different surfaces; diffusion tubes which measure NO2 levels; and bio-indicators — lichens and leaves,” Haklay said. The project’s findings provide location-specific data that can help alert authorities to potential problem zones. “The local authority responded to the results by promising to do their own monitoring in the area and consider how they can manage the traffic in the area.”

Particularly when expensive equipment or lab analysis is needed, resource limitations can create challenges. However, Haklay points out some unique benefits. “Citizen science provides additional information about the context — local knowledge about the place where the monitoring is taking place,” said Haklay. “Participants can also put equipment in their own homes, which is complex for researchers or government agencies.” The citizen science water study in Flint, Michigan, is a good example of this.

Constraints, of course, are not just funding-related. “Not all people would want to do it, and not everyone will have the skills, though we need to consider how to help people in developing them,” Haklay said. “The limitations are the knowledge that people have, their perception of science and their own capabilities, and the abilities of those who manage citizen science projects to engage at such levels. We shouldn’t expect all scientists to be able to facilitate the whole process on their own.”

Haklay suggests that government agencies looking to incorporate citizen science in their data gathering processes should consult the report, Choosing and Using Citizen Science, produced by the UK’s Centre for Ecology and Hydrology. The report reviews resource and management issues, political issues, as well as scientific issues.

The key to citizen science is that it can involve a range of activities. “Participants can help in setting the research question, create protocols that are suitable to their local culture and needs, analyze the information, participate in the production of reports and papers — in short, in everything,” Haklay said. “The value is in making science more open and more collaborative.”

Interested in learning more about Muki Haklay’s citizen science work? Follow him on Twitter: @mhaklay
If you have thoughts or questions about this article, get in touch with Naomi Bloch, Geothink’s digital journalist, at naomi.bloch2@gmail.com.

GIS in the City: Toronto on the Map

Map of Toronto school nutrition program distributionBy Naomi Bloch


This Wednesday, November 18, marks the 16th annual GIS Day. Throughout the week, Geothink will present a series of posts looking at some of the ways in which our collaborators, partners, and friends around the world are critically examining and using GIS as a tool for civic engagement and understanding.
The community snapshots presented this week highlight diverse perspectives and uses for GIS. 

If you make your way to Toronto’s City Hall on Wednesday, you’ll discover that the City is displaying a slideshow of some pretty interesting maps, just above the 3D model of the downtown core. The big-screen projection, set up for Geography Awareness Week and GIS Day, showcases some of the ways that Toronto’s municipal divisions are using GIS to tackle urban issues.

These same projects can also be perused at your leisure via a new City of Toronto GIS Day landing page. The City of Toronto is one of Geothink’s municipal partners.

City of Toronto's Ventilation Index map. All images © City of Toronto 1998-2015. Used with permission.

City of Toronto’s Ventilation Index map. All images © City of Toronto 1998-2015. Used with permission.

The breadth of projects may surprise Toronto residents. Take the Environment and Energy Division’s (EED) Ventilation Index. The EED is mapping the city to get a full spatial understanding of areas known as “urban canyons,” narrow open spaces confined between built spaces that contribute to ground-level pollution — a problem most noticeable to pedestrians in the city. The higher the ventilation index, the greater the level of pollution. The Ventilation Index researchers’ goal is to try to identify “how the City’s changing building profile may have growing adverse effects at ground level and how to mitigate and adapt to the rapidly growing City.”

The City’s uses of GIS extend beyond urban planning or trying to understand how urban design impacts the environment. The Department of Public Health, for example, is employing GIS to better understand the distribution and funding of school nutrition programs. In 2014, 160,000 Toronto students participated in breakfast, snack and lunch programs, provided in schools and community sites throughout the city. Public Health has mapped the locations where student nutrition programs were in effect in 2014, with each site categorized based on the funding source behind the program. Incorporating census data such as the Low Income Measure, they’ve identified where meal programs are located relative to the City’s designated Neighbourhood Improvement Areas. This spatial mapping of school nutrition programs helps the City to understand which communities remain under-served and where additional funding should be allocated.

Want to know more about how the City of Toronto is using GIS? Head to Metro Hall on Friday, Nov. 20, anytime between 8:00 am and 3:00 pm. A few staff members from the City’s Geospatial Competency Centre will be on hand to answer questions.

For more of Geothink’s GIS Day coverage, see:

If you have thoughts or questions about this story, get in touch with Naomi Bloch, Geothink’s digital journalist, at naomi.bloch2@gmail.com.


Local News Research Project map of Toronto news coverage

Crosspost: How is your Toronto neighbourhood portrayed in the news? Check it out using these interactive maps

This post is cross-posted with permission from April Lindgren and Christina Wong at Local News Research Project. 

By April Lindgren and Christina Wong

Introduction
Concerns about how neighbourhoods are portrayed in the news have surfaced regularly in the Toronto area over the years. But are those concerns valid?

Interactive maps produced by the The Local News Research Project (LNRP) at Ryerson University’s School of Journalism are designed to help Toronto residents answer this question. The maps give the public access to data the research project collected on local news coverage by the Toronto Star and the online news website OpenFile.ca. The maps can be used by members of the public and researchers to:

  • get an overall sense of where news in the city is – and isn’t – covered
  • compare patterns of local news coverage by two different news organizations
  • examine the city-wide geographic patterns of reporting on crime, entertainment and other major news topics
  • examine news coverage in each of Toronto’s 44 wards including how often the news stories and photographs reference locations in a ward
  • see what story topics are covered in each ward

The maps are based on the Toronto Star’s local news coverage published on 21 days between January and August, 2011. Researchers have found that a two-week sample of news is generally representative of news coverage over the course of a year (Riffe, Aust & Lacy, 1993). The data for OpenFile.ca, which suspended publishing in 2012, were collected for every day in 2011 between January and August.

Click here to see the maps or continue reading to find out more about news coverage and neighbourhood stereotyping, how the maps work, and the role of open data sources in this project.


Local news and neighbourhood stereotyping
The decision to explore news coverage of Toronto neighbourhoods was prompted by concerns expressed by citizens and local politicians about how certain parts of the city are portrayed in the local media. Residents were furious (Pellettier, Brawley & Yuen, 2013), for instance, when Toronto Star columnist Rosie Dimanno referred to the city’s Scarborough area as “Scarberia” in an article about former mayor Rob Ford’s re-election campaign (DiManno, 2013). Back in 2007, then-mayor David Miller went so far as to contact all of the city’s news media asking them to cite the nearest main intersection rather than reporting more generally that a particular crime occurred in Scarborough (Maloney, 2007). In Toronto’s west end, the local city councillor suggested negative connotations associated with the Jane and Finch neighbourhood could be diffused by renaming it University Heights, but the idea was vehemently rejected by residents (Aveling, 2009).

A study that investigated how Toronto’s most disadvantaged neighbourhoods were covered by the Toronto Star concluded that there was very little coverage of news in these communities (Lindgren, 2009). The study, which examined Toronto Star local news reporting in 2008, also found that crime tended to dominate the limited coverage that did take place and suggested the problem could be rectified not by ignoring crime stories, but by increasing coverage of other sorts of issues in those communities.


Exploring the maps
The interactive maps allow users to explore local news coverage in the City of Toronto. A sample of local stories and photographs from the Toronto Star (the local newspaper with the largest circulation in the city) and OpenFile.ca (a community-based news website) were identified and analyzed in 2011 to capture data about story topics and mentions of geographic locations.

These maps make the data available to the public in a way that allows users to explore and compare media coverage in different areas of the city. Users can zoom in on a neighbourhood and discover all of the locations referenced within a neighbourhood. Each point on the map represents a location that was referenced in one or more news items. Users can click on any of these points to see a list of news articles associated with each location (Figure 1).

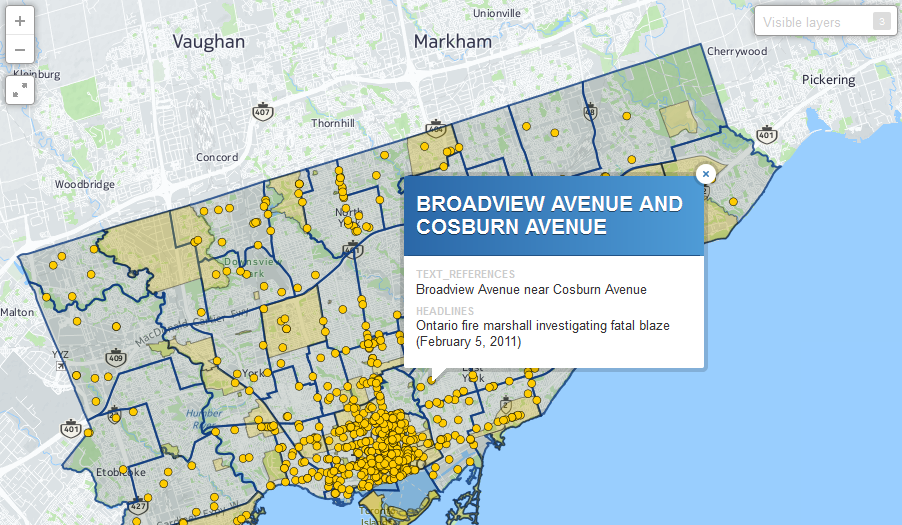
Figure 1. Users can click each point to find out about the news articles that referenced the location

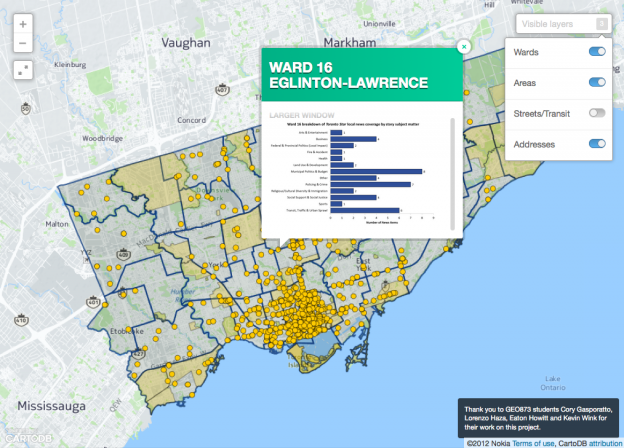
By clicking within a ward boundary, users can also access a summary chart describing the breakdown by subject of all local news coverage in that ward. Users interested in the Scarborough area, for instance, can zoom into that area on the map and click on each Scarborough ward to see what sorts of stories (crime, transit, entertainment, sports, etc.) were reported on in that ward (Figure 2).

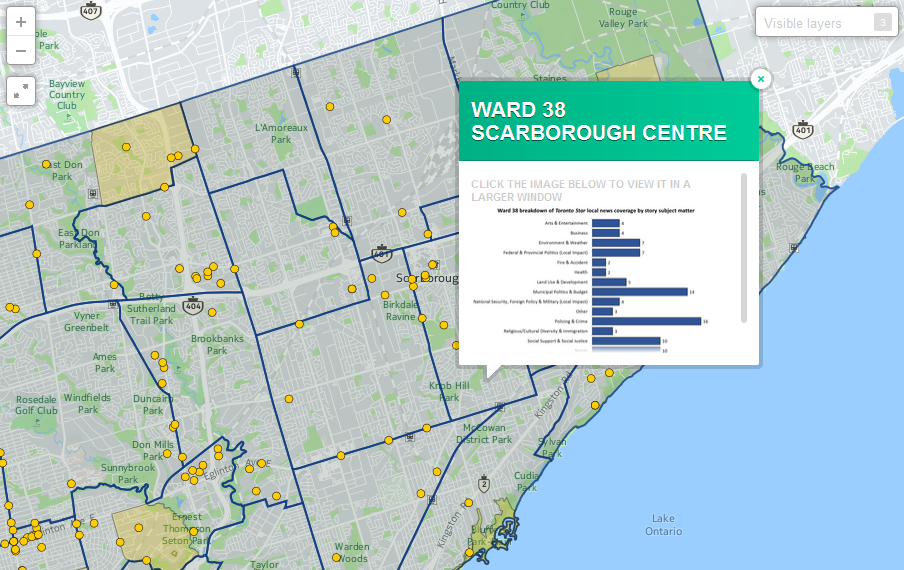
Figure 2. Users can click within a ward to access charts summarizing news coverage by topic

Users interested in how and where a particular news topic is covered can access separate interactive maps for the top five subjects covered by the two news sources. Figure 3, for example, shows all locations mentioned in crime and policing stories published by the Toronto Star during the study’s sample period.

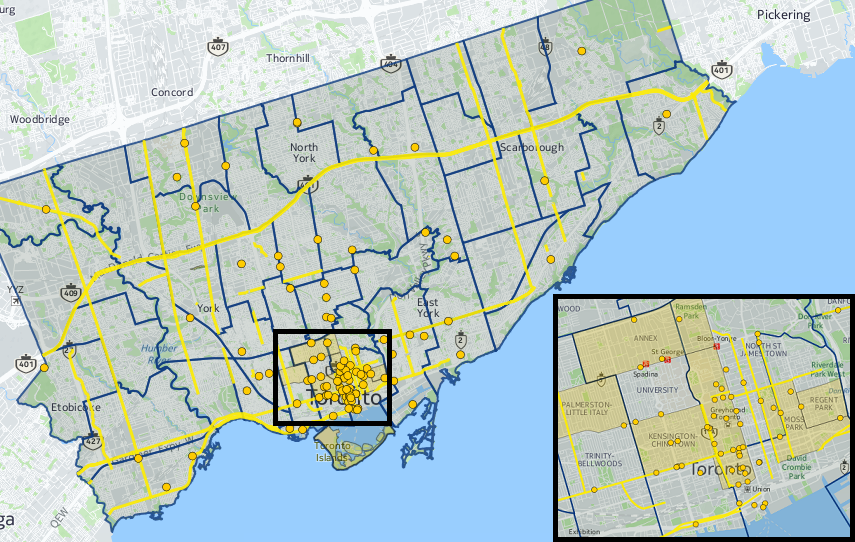
Figure 3. Toronto Star coverage of crime and policing news

The role of open data sources in creating these maps
A total of 23 pre-existing datasets were used to support the creation of these interactive maps including relevant open datasets that were publically available online in 2008. The datasets were used to populate a list of geographic locations in the GTA that had the potential to be referenced in local news stories. Each dataset was assigned unique numerical codes and all 23 datasets were appended to a geographic reference table that coders could search. The incorporated reference list of geographic locations and features allowed for a more accurate and efficient coding process: Coders entering information about spatial references in local news items were able to select many of the referenced geographic locations from the pre-populated list rather than entering the information manually. This improved accuracy because it helped prevent human error and also sped up the coding process.

We would have preferred to use more open data sources during the initial development of the database, but this wasn’t possible due to limited availability of datasets with the spatial attributes that make mapping possible. At that time, only two of the 23 datasets used (approximately 8.7% of the total) were available from open data sources in a format that included geography (such as shapefiles). Both files were obtained from the City of Toronto’s Open Data website. These limitations meant that the majority of the database relied on contributions from private data sources.

The situation has improved over time as more open government data become available in geographic file formats that support research with spatial analysis. As of mid-2015, six more of the 23 datasets (two federal, one provincial and three municipal) used in the database have become available. If we were creating the database today, a total of eight datasets or 34.8% of the initial database could be populated using open data sources (Table 1).

Table 1. Availability of open data sources
Available in 2008 when the database was created Currently available
Private sources 21 15
Government open data 2   (8.7% of database) 8 (34.8% of database)
Total # of datasets 23 23


Since 2008, the Government of Canada has launched its own open data portal, joined the Open Government Partnership alongside other countries supporting the release of open government data, and adopted the G8 Open Data Charter (Standing Committee on Government Operations and Estimates, 2014). Provincial and municipal governments have made similar improvements to open data access. The Government of Ontario launched an online open data catalogue in 2012 and is currently developing an Open Data Directive to be implemented later this year (Fraser, 2015). The City of Toronto introduced its open data portal in 2009 and developed an Open Data Policy in 2012 (City of Toronto, n.d.).

As Table 1 suggests, however, further improvements are required to reduce barriers to research and innovation. A report from the Standing Committee on Government Operations and Estimates, for instance, recommended that the federal government provide data at smaller levels of geography, work together with different levels of government to establish standards and release data, and provide a greater variety of open data to reflect all government departments. The report noted that the release of open data can improve government efficiency, foster citizen engagement, and encourage innovation (Standing Committee on Government Operations and Estimates, 2014). Academic researchers have argued that improvements in the availability of open government data would stimulate valuable research and outcomes with economic and social value (Jetzek, Avital & Bjorn-Andersen, 2014; Kucera, 2015; Zuiderwijk, Janssen & Davis, 2014). Journalists are also pushing for easier and greater access to data (Schoenhoff & Tribe, 2014).


Conclusion
Research conducted by the Local News Research Project was made possible by public funds and as such the data should be widely available. The interactive maps are an attempt to fulfill that obligation.

While the maps capture only a snapshot of news coverage at a fixed point in time, they nonetheless demonstrate the importance of geospatial analysis in local news research (Lindgren & Wong, 2012). They are also a powerful data visualization tool that allows members of the public to independently explore media portrayals of neighbourhoods and the extent to which some parts of a city are represented in the news while others are largely ignored.

Finally, this mapping project also illustrates how open government data can foster research and how much there is still to do in terms of making data available to the public in useful formats.


The Local News Research Project was established in 2007 to explore the role of local news in communities. Funding for this research has been provided by Ryerson University, CERIS-The Ontario Metropolis Centre and the Social Sciences and Humanities Research Council.

About the authors: Lindgren is an Associate Professor in Ryerson University’s School of Journalism and Academic Director of the Ryerson Journalism Research Centre. Christina Wong is a graduate of Ryerson University’s Geographic Analysis program. Initial work on the maps was done in 2014 by GEO873 students Cory Gasporatto, Lorenzo Haza, Eaton Howitt and Kevin Wink from Ryerson University’s Geographic Analysis program.


References

Avaling, N. (2009, January 8). Area now being called University Heights, but some call change a rejection of how far we’ve come. Toronto Star, p. A10.

City of Toronto. (n.d.). Open Data Policy. Retrieved from http://www1.toronto.ca/wps/portal/contentonly?vgnextoid=7e27e03bb8d1e310VgnVCM10000071d60f89RCRD

DiManno, R. (2013, July 6). Ford fest makes a strategic move. Toronto Star, p. A2.

Jetzek, T., Avital, M. & Bjorn-Andersen, N. (2014). Data-driven innovation through open government data. Journal of Theoretical and Applied Electronic Commerce Research, 9(2), 100-120.

Fraser, D. (2015, May 1). Ontario announces more open data, public input. St. Catharines Standard. Retrieved from http://www.stcatharinesstandard.ca/2015/05/01/ontario-announces-more-open-data-public-input

Kucera, J. (2015). Open government data publication methodology. Journal of Systems Integration, 6(2), 52-61.

Lindgren, A. (2009). News, geography and disadvantage: Mapping newspaper coverage of high-needs neighbourhoods in Toronto, Canada. Canadian Journal of Urban Research, 18(1), 74-97.

Lindgren, A. & Wong, C. (2012). Want to understand local news? Make a map. 2012 Journalism Interest Group proceedings. Paper presented at Congress 2012 of the Humanities and Social Sciences conference. Retrieved from http://cca.kingsjournalism.com/?p=169

Maloney, P. (2007, January 16). Mayor sticks up for Scarborough. Toronto Star. Retrieved from http://www.thestar.com/news/2007/01/16/mayor_sticks_up_for_scarborough.html?referrer=

Pellettier, A., Brawley, D. & Yuen, S. (2013, July 11). Don’t call us Scarberia [Letter to the editor]. Toronto Star. Retrieved from http://www.thestar.com/opinion/letters_to_the_editors/2013/07/11/dont_call_us_scarberia.html

Riffe, D., Aust, C. F. & Lacy, S. R. (1993). The effectiveness of random, consecutive day and constructed week sampling. Journalism Quarterly, 70, 133-139.

Schoenhoff, S. & Tribe, L. (2014). Canada continues to struggle in Newspapers Canada’s annual FOI audit [web log post]. Retrieved from https://cjfe.org/blog/canada-continues-struggle-newspapers-canada%E2%80%99s-annual-foi-audit

Standing Committee on Government Operations and Estimates. (2014). Open data: The way of the future: Report of the Standing Committee on Government Operations and Estimates. Retrieved from http://www.parl.gc.ca/content/hoc/Committee/412/OGGO/Reports/RP6670517/oggorp05/oggorp05-e.pdf

Zuiderwijk, A., Janssen, M. & Davis, C. (2014). Innovation with open data: Essential elements of open data ecosystems. Information Polity, 19(1, 2), 17-33.

Crosspost: Green Cities and Smart Cities: The potential and pitfalls of digitally-enabled green urbanism

The Vancouver Convention Centre in Vancouver, BC, Canada was the world's first LEED Platinum-certified convention center. It also has one of the largest green roofs in Canada. Image Credit: androver / Shutterstock.com

The Vancouver Convention Centre in Vancouver, BC, Canada was the world’s first LEED Platinum-certified convention center. It also has one of the largest green roofs in Canada. Image Credit: androver / Shutterstock.com

This post is cross-posted with permission from Alexander Aylett, from UGEC Viewpoints. Aylett is an Assistant Professor at the Centre on Urbanisation, Culture and Society at the National Institute for Scientific Research (UCS-INRS) in Montreal, Quebec.

By Alexander Aylett

Since its early days, the discourse around “smart cities” has included environmental sustainability as one of its core principles. The application of new digital technologies to urban spaces and processes is celebrated for its ability to increase the well-being of citizens while reducing their environmental impacts. But this engagement with sustainability has been limited to a technocratic focus on energy systems, building efficiency, and transportation. It has also privileged top-down interventions by local government actors. For all its novelty, the smart cities discussion is operating with a vision of urban sustainability that dates from the 1990s, and an approach to planning from the 1950s.

This definition of “urban sustainability” overlooks key facets of a city’s ecological footprint (such as food systems, resource consumption, production related greenhouse gas emissions, air quality, and the urban heat island effect). It also ignores the ability of non-state actors to contribute meaningfully to the design and implementation of urban policies and programs. But that doesn’t need not be the case. In fact, if employed properly, new information technologies seem like ideal tools to address some of urban sustainability’s most persistent challenges.

Progress and Lasting Challenges in Local Climate Governance

Let’s take a step back. Often discussions of smart cities begin with an account of the capabilities of specific technologies or interfaces and then imagine urbanism – and urban sustainability – through the lense of those technologies. I’d like to do the opposite: beginning with the successes and lasting challenges faced by urban sustainability and interpreting the technologies from within that context. To understand the role that “smart” technologies could play in enabling sustainable cities, it’s useful to first look at what we have managed to accomplish so far, and what still needs to be done.

For those of us working on sustainable cities and urban responses to climate change, the past two decades have been a period of both amazing successes and enduring challenges. In the early 1990s a handful of cities began promoting the (at that time) counterintuitive idea that local governments had a key role to play in addressing global climate change. Since then, the green cities movement has won significant discursive, political, and technical battles.

Global inter-municipal organizations like ICLEI or the C40 now have memberships that represent thousands of cities. Two decades of work have created planning standards and tools and an impressive body of “best practice” literature. Through the sustained efforts of groups like ICLEI, cities are now recognized as official governmental stakeholders in the international climate change negotiations coordinated by the United Nations.

But – crucially – real urban emissions reductions are lagging well below what is needed to help keep global CO2 within safe limits. Looking at the efforts of individual cities and the results of a global Urban Climate Change Governance survey that I conducted while at MIT (Aylett 2014, www.urbanclimatesurvey.com ) shows why. Apart from a small contingent of charismatic cities like Vancouver, Portland, or Copenhagen, cities are struggling to move beyond addressing the “low hanging fruit” of emission from municipal facilities ( i.e., vehicle fleet, municipal buildings, street lighting – known as “corporate emissions”) to taking action on the much more significant emissions generated by the broader urban community (i.e., business, industry, transportation, and residential emissions).

This problem has been with us since the early days of urban climate change responses. But how we understand it has changed significantly. Where some cities used to inventory only their corporate emissions, this is now rare. Current guidelines cover community-wide emissions and work is underway to create a global standard for emissions inventories that will also engage with emissions produced in the manufacture of the goods and services consumed within cities (see Hoornweg et al. 2011).

Built on the increased scope of our technical understanding of urban emissions, is a change in how we understand the work of governing climate change at the local level. A top-down vision of climate action focused on the regulatory powers of isolated local government agencies is being replaced by one that is horizontal, relational, and collaborative. This approach transforms relationships both inside and outside of local governments, by linking together traditionally siloized municipal agencies and also forging partnerships with civil-society and business actors (Aylett 2015).

The increased prominence of non-state actors in urban climate change governance has led to growing calls for partnerships across the public-private divide (Osofsky et al. 2007; Andonova 2010; Bontenbal and Van Lindert 2008). These partnerships play an important role in overcoming gaps in capacity, translating the climate change impacts and response options into language that is meaningful to different groups and individuals, and accelerating the development of solutions. Follow-up analysis of the 2014 MIT-ICLEI Climate survey shows that these partnerships have an important positive impact on the scope of concrete emissions reductions. Cities with stronger partnerships appear to be more able to create concrete emissions reductions outside of areas directly controlled by the municipality.

The street car in Portland, Oregon, USA. Image Credit: Shutterstock.com

The street car in Portland, Oregon, USA. Image Credit: Shutterstock.com

This evolution in approaches to climate change planning follows a broader current in urban planning more generally which, since the 1960s have moved away from expert driven and technocratic processes and created increasing amounts of space for participatory processes and facilitative government.

In a nutshell, an increasingly complex and holistic technical understanding of urban emissions is being matched by an increasing horizontal and networked approach to governing those emissions. (A similar shift is taking place in the more recent attention to urban adaptation and resilience.)

But plans and programs based on this understanding quickly run into the significant barriers of institutional siloization and path dependency, a lack of effective information sharing, challenges of data collection and analysis, and difficulty mobilizing collective and collaborative action across multiple diverse and dispersed actors (Aylett 2014). The strength of collaborative multi-stakeholder responses is also their weakness. While effective climate change action may not be possible without complex networks of governance, coordinating these networks is no simple task. The subject of urban climate change governance has been the focus of an expanding body of research (Aylett 2015, 2014, 2013; Betsill & Bulkeley 2004, 2007; Burch 2010; Burch et al. 2013; Romero-Lankao et al. 2013.)

“Smart” Urban Climate Governance

Seen from this perspective, the allure of “smart” approaches to green cities is precisely the fact that information technology tools seem so well suited to the challenges that have stalled progress so far. Collecting, sharing and analysing new and existing data, and coordinating complex multi-scalar social networks of collaborative design and implementation are precisely what has drawn attention to new technologies in other sectors.

Disappointingly, current applications of a data-driven and technologically enabled approach to urban sustainability are far from delivering on this potential. Reading through the literature shows that the many interesting works that address the impacts of new technologies on urban governance (for example Elwood 2010, Evans-Cowley 2010, Goldsmith and Crawford 2015, Moon 2002) have nothing to say about the governance of urban sustainability. Work that does address environmental sustainability is dominated by a technocratic focus on energy systems, building efficiency, and transportation that privileges top-down action by municipal experts and planning elites (The Climate Group 2008, Boorsma & Wagener 2007, Kim et al. 2009, Villa & Mitchell 2009). This literature review is ongoing, and I continue to hope to find a body of work that combines a developed understanding of urban sustainability with a detailed reflection on digital governance. As it is, we seem to be working with outdated approaches to both urban sustainability and planning.

An off-shore wind farm near Copenhagen, Denmark. Image Credit: Shutterstock.com

An off-shore wind farm near Copenhagen, Denmark. Image Credit: Shutterstock.com

How to update this approach, and use the full potential of data-driven, technologically enabled, and participatory approaches to spur accelerated transitions to sustainable cities is a key question. This research is necessary if we are going to unlock the full potential of the “smart” urbanism to address the necessity of building sustainable cities. It is also important that we avoid rolling back the clock on two decades of “green cities” research by basing our digital strategies around outdated understandings of the urban sustainability challenge.

Conclusions

Cities are responsible for as much as 70% of global greenhouse gas emissions and consume 75 percent of the world’s energy (Satterthwaite 2008). These figures are often repeated. But taking action at that scale requires both technological and socio-institutional innovations. Efforts to reduce urban emissions are challenged by the complexity of coordinating broad coalitions of action across governmental, private, and civil-society actors, and the need to effectively collect, share, and analyse new and existing data from across these traditionally siloized sectors.

These complexities have played an important role in limiting actual urban emissions reductions far below what is needed to stabilize global emissions within a safe range. Interestingly, these complexities are also the very strengths of emerging information and communications technologies (ICT) tools and Geoweb enabled approaches to urban planning and implementation. Currently, the use of “smart” approaches to address the urban climate challenge has been limited to narrow and technocratic initiatives. But much more is possible. If effective bridges can be built between the ICT and Urban Sustainability sectors, a profound shift in approaches to the urban governance of climate change could be possible. It is important to increase both sustainability and digital literacy among those involved. Only then will innovations in urban sustainability benefit from a deep understanding of both the new tools at our disposal, and the complex challenge to which we hope to apply them.

(A previous version of this was presented as part of the Geothink pre-event at the 2015 American Association of Geographers conference in Chicago. IL. See: www.geothink.ca)

Alexander Aylett is Assistant Professor at the Centre on Urbanisation, Culture and Society at the National Institute for Scientific Research (UCS-INRS) in Montreal, Quebec, Canada.

Geothoughts 3: Edmonton Ascending to the World Stage as a Truly Open City

Edmonton is working to be on par with the world’s smart cities through an open city initiative that will revolutionize the life of the city’s citizens.

Edmonton is working to be on par with the world’s smart cities through an open city initiative that will revolutionize the life of the city’s citizens.

By Drew Bush

In our third edition of Geothoughts, we’re excited to bring you an interview with Yvonne Chen, a strategic planner for the city of Edmonton’s Open City Initiative. You can also subscribe to this podcast by finding it on iTunes.

In this interview, we talk with Chen about what it means for Edmonton to be on par with the world’s smart cities, the open city initiative due before the Edmonton City Council and future projects that will revolutionize the life of the city’s citizens.

Thanks for tuning in. And we hope you subscribe with us at Geothoughts on iTunes. A transcript of this original audio podcast follows.

TRANSCRIPT OF AUDIO PODCAST

Welcome to Geothoughts. I’m Drew Bush.

[Geothink.ca theme music]

Edmonton’s City Council has yet to consider an Open City Initiative that may cement the city’s status as one of the world’s newest smart cities. But as we wait for the council to take action, we bring you a deeper look at the Initiative from Yvonne Chen, a strategic planner for the city who has helped orchestrate the Initiative.

“Edmonton is aspiring to fulfill its role as a permanent global city, which means innovative, inclusive and engaged government. So Open City acts as the umbrella that encompasses all the innovative open government work within the city of Edmonton.”

That was Chen in an article published on Geothink.ca a few weeks ago. Her work on the initiative follows close on the heels of a 2010 decision by city leaders to be the first to launch an open data catalogue and the 2011 awarding of a $400,000 IBM Smart Cities Challenge award grant.

In March, the city cemented a partnership with Startup Edmonton when they announced the Open Labs project to connect city staff with the six-year-old group to work on solving problems using the city’s data. Startup Edmonton’s aim is to bring developers, designers, makers, founders, investors and mentors together in one place with a goal of using their strengths collaboratively to encourage the development of startup companies based on technological innovation.

For the city, some initiatives have included using advanced analysis of open data streams to enhance crime enforcement and prevention, and interactive neighborhood maps that will help Edmontonians locate and examine waste disposal services, recreational centers, transit information, and capitol projects. In fact, one of Edmonton’s most notable projects has included providing free public Wi-Fi around the city’s LRT stations, with plans for an expansion to all trains and tunnels.

However, not all of the city’s efforts have worked exactly as planned. In particular, questions have been raised by the city council about the sheer volume of smartphone applications that have been developed by the city and the efficacy of some of them. City officials believe the collaboration may serve to fix this, or at least reduce the cost of when they don’t work as planned, according to The Edmonton Sun.

For Chen, the release of the Open City Initiative represents the culmination of years of work.

“My role throughout this entire release was I was helping to conduct the public consultation sessions, I was analyzing information, and I was writing the Open City initiative documents as well as a lot of the actual policy itself.”

In fact, the document outlines city policy, action plans for specific initiatives, environmental scans (or reviews), and results from public consultations on city initiatives. More than 1,800 Edmontonians commented on the initiative last October before it was revised and updated for the Council.

“The city of Edmonton’s Open City Initiative is a municipal perspective of the broader open government philosophy… It guides the development of innovative solutions in the effort to connect Edmontonians to city information, programs, services and any engagement opportunities.”

Like many provincial and federal open city policies, the document focuses on making Edmonton’s government more transparent, accountable and accessible. Unlike such policies, Chen said, it also focuses on including citizens in the design and delivery of city programs and services through deliberate consultations, presentations, public events and online citizen panels. In fact, more than 2,200 citizens are on just the panel asked questions by city officials as they design the initiative’s infrastructure.

And just as the Canadian Government celebrated it’s second annual CODE Hackathon this past February, Edmonton hosted its second annual city hackathon on February 21st.

“We had more than fifty participants actually stay the whole day and develop different mobile applications and other projects. Some of the more technological-based solutions used the city’s open data catalogue.”

Some of these applications may one day hit the city’s streets. Of interest, according to Chen, are one team’s project to consolidate all of the city and affiliated organization’s disparate Twitter feeds into one Twitter box that citizens can personalize, and a project that made use of multiple data sets to allow users to rank neighborhoods by socio-demographic variables for a variety of purposes including determining what types of schools are nearby.

[Geothink.ca theme music]

[Voice over: Geothoughts are brought to you by Geothink.ca and generous funding from Canada’s Social Sciences and Humanities Research Council.]

###

If you have thoughts or questions about this podcast, get in touch with Drew Bush, Geothink’s digital journalist, at drew.bush@mail.mcgill.ca.