This is a cross-post from Geothink co-applicant Dr. Claus Rinner‘s website, written by Geothink student Sarah Greene, Ryerson University. Sarah is Candidate for the Master’s of Spatial Analysis at Ryerson University. Her research focusses on open data.
By Sarah Greene
This past week, URISA held its 54th annual GIS-Pro conference in Toronto, bringing together GIS professionals and businesses from around the world. The conference provided many interesting sessions including one focused entirely on open data. This session, titled “Leveraging Open Data”, included government as well as private sector perspectives.
The session began with a presentation from the Government of North Carolina, discussing the importance of metadata. They are currently collaborating with a number of agencies to create and share a metadata profile to help others open up their data and understand how to implement the standards suggested. They have produced a living document which can be accessed through their webpage.
The next speaker at the session represented Pitkin County in Colorado. They represent an open data success story with a number of great resources available for download on their website including high quality aerial imagery. An important aspect to their open data project was their engagement with their local community to understand what data should be opened, and then marketing those datasets which were released.
The Government of Ontario was also present as this session, presenting on the current status of open data for the province. The Ontario Government promotes an Open by Default approach and currently has over 500 datasets from 49 agencies available to download through their portal. They are working towards continuing to increase their open datasets available.
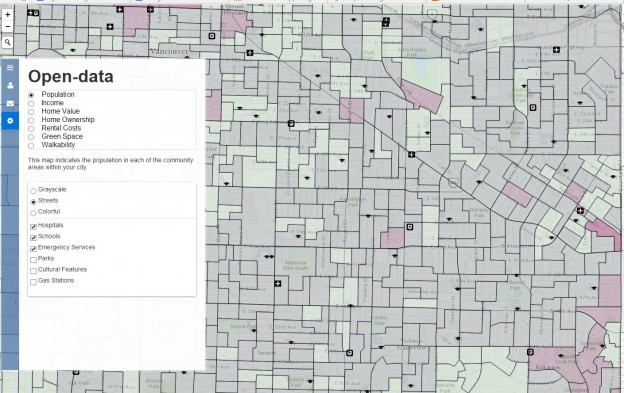
A presentation by MapYourProperty provided an interesting perspective from the private sector using open data to successfully run their business. They heavily depend on visualizing open data to provide a web-based mapping application for the planning and real estate community to search properties, map zoning information and create a due diligence report based on the information found. This is one example of many that exist in the private sector of open data helping build new companies, or help existing companies thrive.
Lastly, a representative from Esri Canada’s BC office wrapped up the session reminding us all of the importance of opening data. This included highlighting the seemingly endless benefits to open data, including providing information to help make decisions, supporting innovation, creating smart cities and building connections. Of course, open data is big business for Esri too, with the addition of ArcGIS Open Data as a hosted open data catalog to the ArcGIS Online platform.
This session showcased some great initiatives taking place in Canada and the United States that are proving the importance of opening up data and how this can be done successfully. It is exciting to see what has been taking place locally and internationally and it will be even more exciting to see what happens in the future, as both geospatial and a-spatial data products continue to become more openly available.
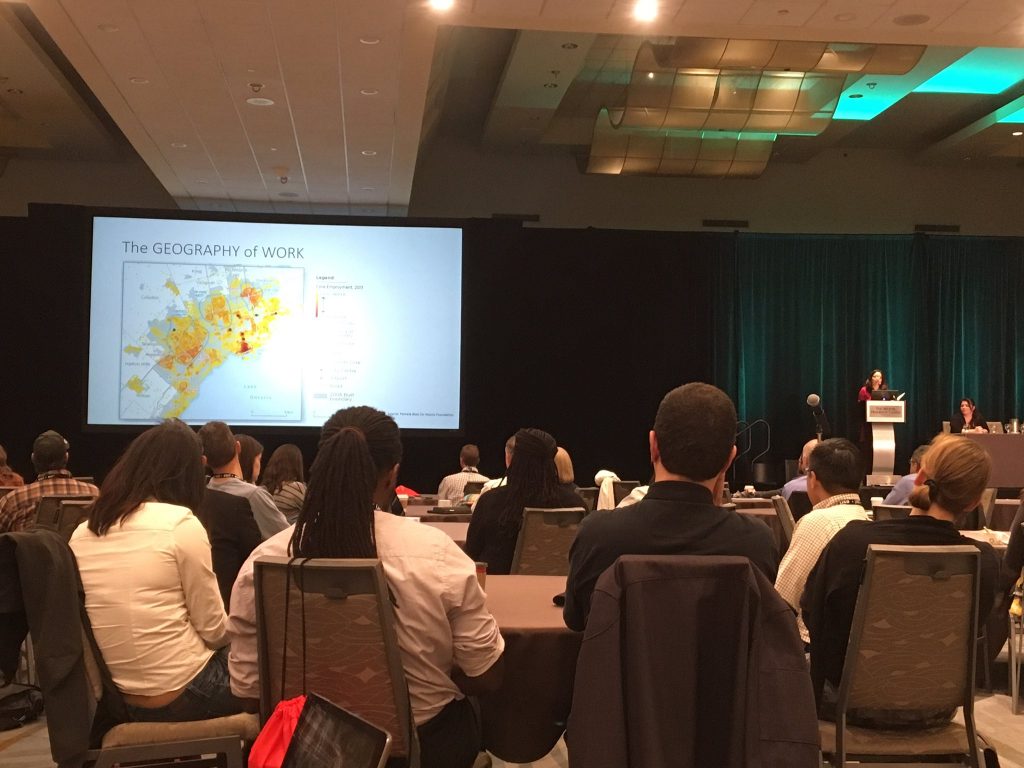
A talk at the GIS Pro 2016 conference. Photo credit: Claus Rinner
See the original post here