Tag Archives: Statistics Canada

Innovative Urban Planning Solutions and GPS Guided Biking – Summer Institute Day 3

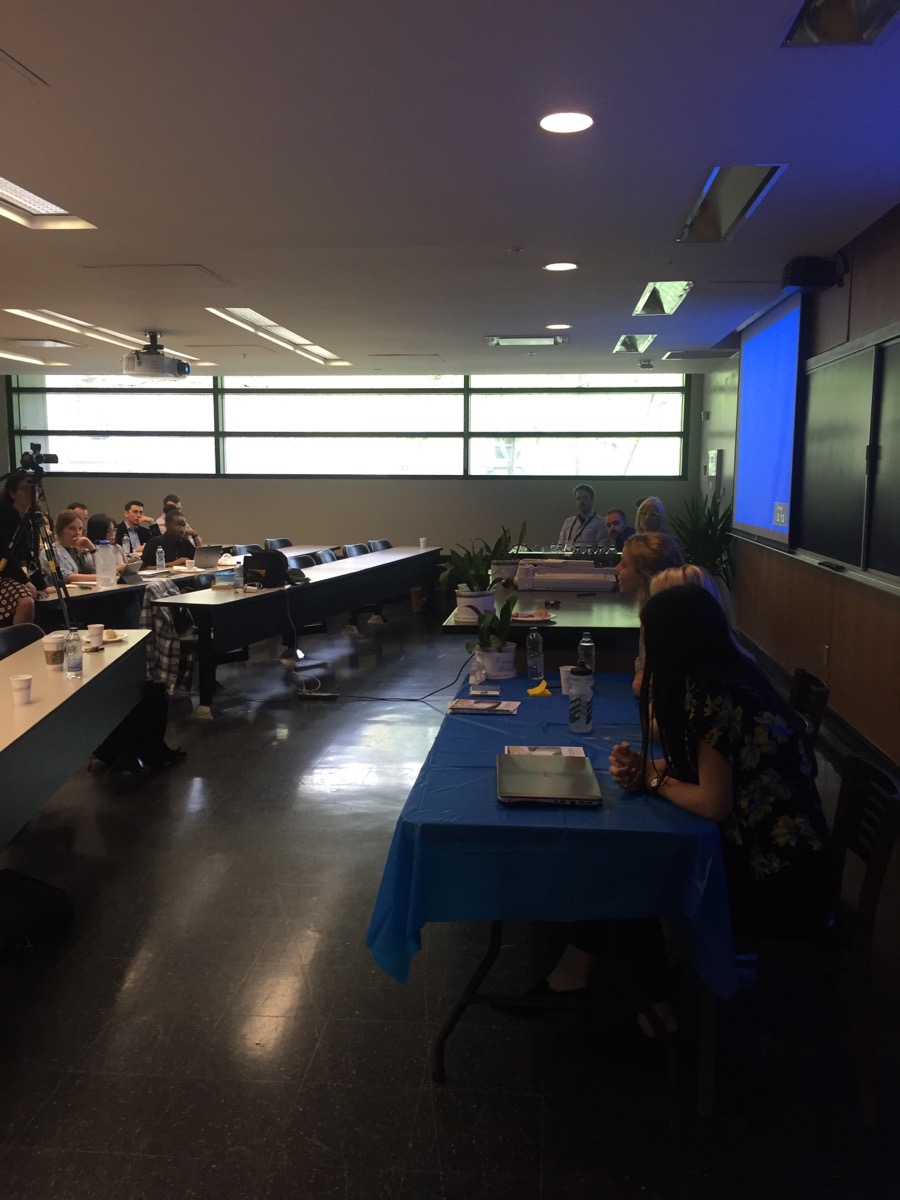
Rachel Bloom, Julia Conzon and Elizabeth Barber took questions from the audience on day three of the Geothink 2017 Summer Institute after talking about their career paths post Geothink.

By Drew Bush

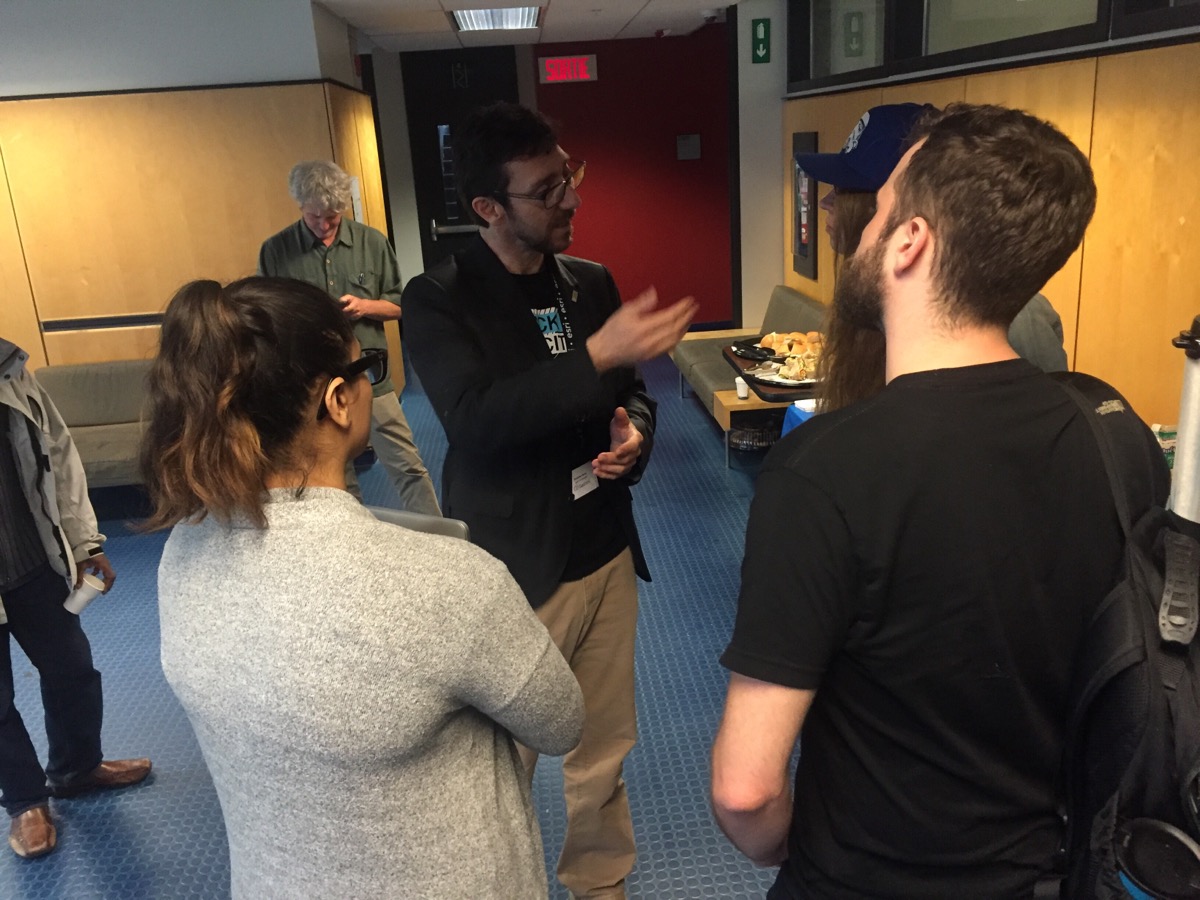
Geothink Co-Applicant Stéphane Roche, associate professor in University Laval’s Department of Geomatics, chats with students during a coffee break on day three of Geothink’s 2017 Summer Institute.

The third day of Geothink’s 2017 Summer Institute opened with Open North Executive Director Jean-Noé Landry discussing how Geothink’s collaborative approach begets research with practical applications for smart cities. A pair of Montreal entrepreneurs and a trio of former students elaborated on this perspective in their own subsequent presentations.

“We’re going to talk about enabling innovation,” Noe said to start the morning. “I’ve been following some of the conversations that you’ve been having with all these great folks that have come in over the course of the week…And today, you know, we’ve got an opportunity to look at a few people that have been able to do some great work.”

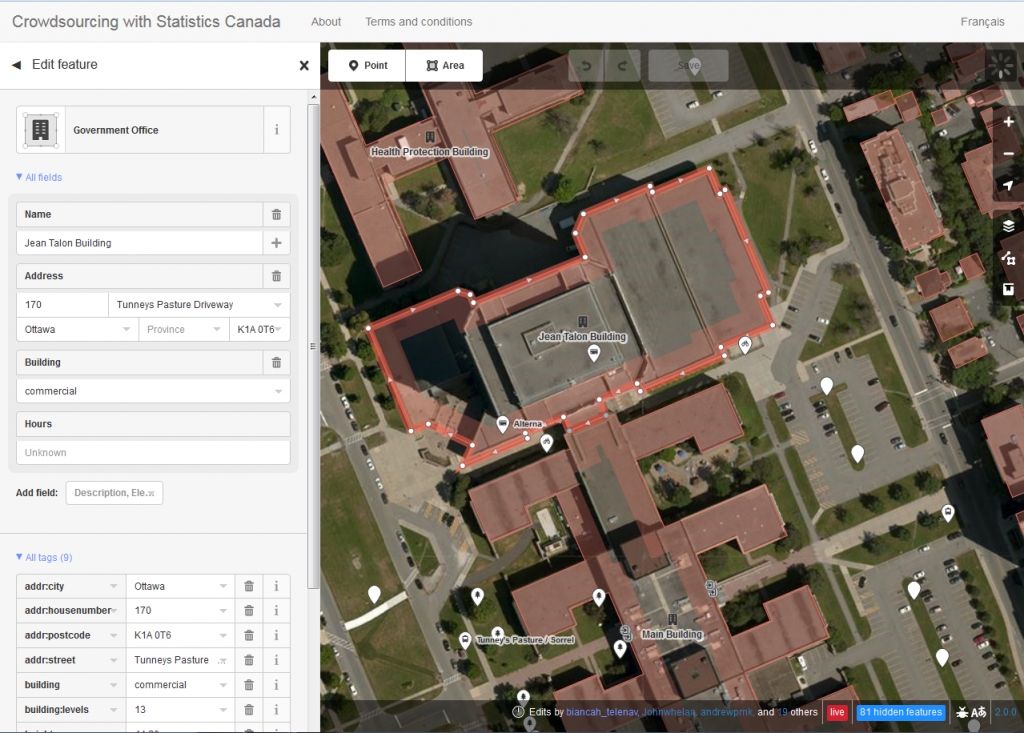
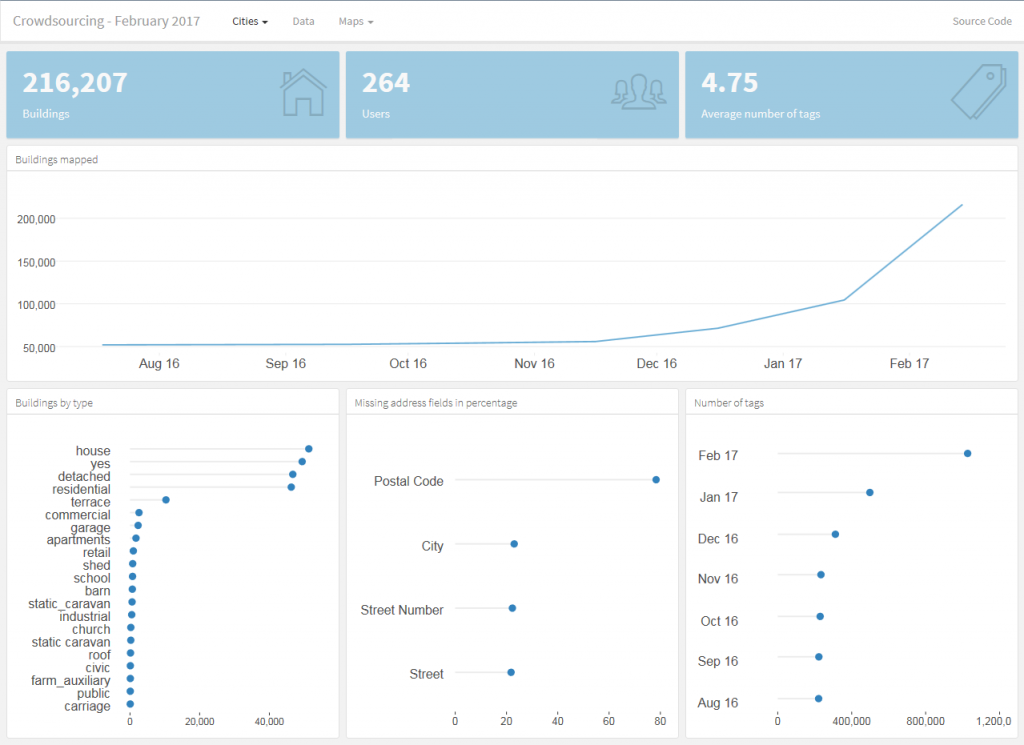
Two previous Geothink students followed with talks on their differing career trajectories after graduating from McGill University. Rachel Bloom is currently working as the project lead for Open North on Smart Open Cities; and Julia Conzon spoke of her work with open data at Statistics Canada. Elizabeth Barber, a master’s of public services student at University of Waterloo, talked about her summer work with the City of Montreal. They were preceded by Xavier Peich, a co-founder of SmartHalo, and Vincent-Charles Hodder, a co-founder of Local Logic.

The theme of this year’s Institute was “Smart City: Toward a Just City.” An interdisciplinary group of faculty and students tackled many of the policy, legal and ethical issues related to smart cities. Each of the three days of the Summer Institute combined workshops, panel discussions and hands-on learning modules that culminated in a competition judged by Montreal city officials and tech entrepreneurs. The goal of the competition was for student groups to develop and assess the major principles guiding Montreal’s 2015-2017 Montréal Smart and Digital City Action Plan.

The last day provided ample time for students to work within their groups to analyze Montreal’s strategic plan in accordance with a research question assigned by one of the Summer Institute’s faculty members. It also provided time for faculty members who once had been students themselves to reminisce.

“I love the summer institute,” said Victoria Fast, an assistant professor at University of Calgary’s Department of Geography. She herself has participated in the previous summer institutes in 2016 and 2017 and had just recently made the transition to faculty.

“Actually, interestingly, something we haven’t touched upon yet is the synergy between all of them. You know, Institute number one in Waterloo was volunteered geographic information (VGI) and crowdsourcing, the second one in Toronto was crowdsourcing, and this one is smart cities. And all of those concepts are just so fundamentally embedded in each other. And for—I think students who have been to all of them really get this diverse and rich perspective on Geothink from these kind of very relevant topical areas.”

“This one, in particular, I really like from the student perspective, the employment opportunities is really great to hear,” Fast added about the presentations on life after Geothink. “The idea of social entrepreneur, social innovation. I think students in a university really need some hope about jobs and job prospects.”

The Summer Institute faculty, city officials and tech entrepreneurs helped to judge the work of each student group at the end of the day. But the real value lay in the new ideas and understandings each student gained.

One group explored which city services should be prioritized for digitization first while another determined how to quantify what appropriate inclusion of citizens in smart cities of the future might look like. Others examined what open data should be released by cities, the advantages of public Wi-Fi, and how cities can foster collaboration between innovators.

“We tried to develop sites for innovation learning,” Seyed Hossein Chavoshi, a PhD student from Laval University, said. “So there are many things actually we want to take into account. For example, there are the functionality and the design of the place where we want people, for example, to test apps that are actually developed by the municipality. So to do that and to find these places there are many aspects. The functionality is one of them. Another is the ethic. But the functionality is a core one of them—when you want to invite citizens from different cultures, from different groups, from different ages you have to find a place that can at least accommodate all different ages.”

Chavoshi added that he found this year’s Summer Institute quite informative.

“I’m so technical from an engineering point of view,” Chavoshi said. “But here we were so diverse. So like people from law and from a social geography background and [subjects] that, actually, they aren’t often gathered all together. So before that I didn’t actually know that we had to take into account all these aspects. But when I was here and I just listened to the other peoples’ points-of-view, from their background, it helped with when I want to, for example, develop something that can be fascinating to the citizens in a smart city.”

Geothink students, staff and faculty at the 2017 Summer Institute at McGill University in Montreal, QC.

###

If you have thoughts or questions about the article, get in touch with Drew Bush, Geothink’s digital journalist, at drew.bush@mail.mcgill.ca.

A New Narrative for Collecting Statistical Data: Statistics Canada’s Crowdsourcing Project

This is a guest post from Statistics Canada on their new initiative on crowdsourcing geospatial data

Statistics Canada’s crowdsourcing project offers an exciting new opportunity for the agency to collaborate with stakeholders and citizens to produce and share open data with the general public — that is to say, data that can be freely used and repurposed.

Data collection is evolving with technology; for example, paper-based and telephone surveys are increasingly replaced with online surveys. With an array of modern technologies that most Canadians can access, such as Web 2.0 and smartphones, a new mechanism for data sharing can be piloted through open data platforms that host online crowds of data contributors. This project provides insight into how Statistics Canada can adapt these modern technologies, particularly open source tools and platforms, to engage public and private stakeholders and citizens to participate in the production of official statistics.

For the pilot project, Statistics Canada’s goal is to collect quality crowdsourced data on buildings in Ottawa and Gatineau. The data include attributes such as each building’s coordinate location, address and type of use. This crowdsourced data can fill gaps in national datasets and produce valuable information for various Statistics Canada divisions.

On September 15, 2016, Statistics Canada launched a web page and communications campaign to inform and motivate the citizens of Ottawa and Gatineau to participate in the pilot project. This pilot project is governed and developed by Statistics Canada’s Crowdsourcing Steering Committee. Statistics Canada’s communications with the local OpenStreetMap (OSM) community and collaboration with stakeholders and municipalities have allowed the pilot project to succeed.

To crowdsource the data, the project uses OpenStreetMap, an open source platform that aims to map all features on the Earth’s surface through user-generated content. OSM allows anyone to contribute data and, under the Open Data Commons Open Database License (ODbL), anyone can freely use, disseminate and repurpose OSM data. In addition to the web page and campaign to encourage participation, Statistics Canada developed and deployed a customized version of OSM’s iD-Editor. This adapted tool allows participants to seamlessly add points of interest (POIs) and polygons on OSM. The platform includes instructions on how to sign up for OSM and how to edit, allowing anyone, whether tech-savvy or not, to contribute georeferenced data (Figure 1).

Figure 1. Snapshot of the customized version of OSM’s iD-Editor. Users can select a building or POI to see the attributes. Users can edit these attributes or they can create an entirely new point or area.

Statistics Canada has maintained communications with its stakeholders and participants through outreach, and has monitored contributions through dashboards. Outreach has taken place by communicating with the global and local OSM communities by using mailing lists and having local meetups, as well as by organizing webinars, presenting at local universities and participating in conferences associated with open data. Negotiation and collaboration with the City of Ottawa have also opened building footprints and addresses for contributors to add to the map.

The project has been monitored using an open source dashboard developed by Statistics Canada. The dashboard provides a timeline (currently covering August 2016 to February 15, 2017) that specifies the number of buildings mapped, the number of users and the average number of tags contributed on OSM in each target city. Furthermore, it shows the amount of certain building types (e.g., house, residential, commercial) and the number of missing address fields by percentage (Figure 2). In general, the dashboard highlights the increased OSM contributions in Ottawa and Gatineau since the initiation of the project.

Figure 2. The open source dashboard monitors the production of data on OSM within the pilot project’s geographic scope of Ottawa and Gatineau. In the image above, both Ottawa and Gatineau have been selected. As seen in the top graph, buildings mapped in both cities have increased since the project’s initiation.

In the second year of the pilot project, Statistics Canada intends to develop a mobile app that will allow contributors to map on the go. Outreach will be maintained and, as more data are collected, quality assessments will be conducted. Success has been derived through collaborations, learning and sharing ideas, and developing user-friendly open source tools. As the project expands over time, Statistics Canada will uphold these values and approaches to ensure both an open and collaborative environment.

If you are interested in participating in the project, visit Statistics Canada’s Crowdsourcing website for a tutorial or to start mapping. Feel free to contact us at statcan.crowdsource.statcan@canada.ca to subscribe to a distribution list for periodic updates or to ask questions about the project.

Moving Forward with Canadian Census Data

By Naomi Bloch


Chloropleth maps of National Household Survey global non-response data at the dissemination-area level courtesy Scott Bell. Global non-response rates > 50% resulted in suppression of data for that spatial unit. All maps are classified using a quantile classification scheme.


As we move forward (and backward) with the 2016 return of Canada’s long-form census, questions remain for everyone who uses Statistics Canada’s key socio-economic data. Researchers, local government agencies, community organizations, and industry will still need to use data collected via the 2011 National Household Survey and understand how to reconcile that information with long-form census data.

Concerns regarding the reliability of NHS data stem from the lower response rates that resulted from the non-mandatory nature of the 2011 survey. The overall response rate for the survey decreased from 94 percent in 2006 to 69 percent in 2011. Media attention has centred on the fact that Statistics Canada chose not to release survey data for 25 percent of all census subdivisions because response rates for those spatial units were too low. A key question is whether the regions for which we have no reliable data share certain socio-economic characteristics — and if so, how this might impact service provision.

Geothink co-applicant researcher Scott Bell, a professor of Geography and Planning at University of Saskatchewan, has been studying and mapping the spatial patterns of the National Household Survey’s global non-response rates. His work examines various geographic levels, and considers response rate patterns relative to several socio-economic variables. Bell found that across the 15 cities he studied, there are many commonalities between areas where response rates are similar.

In this video interview, Bell discusses his research and its implications.

For more from Scott Bell, see also: The Long-term Impacts of the Short-Lived National Household Survey

If you have thoughts or questions about this video interview, get in touch with Naomi Bloch, Geothink’s digital journalist, at naomi.bloch2@gmail.com.

The Long-term Impacts of the Short-lived National Household Survey

Tweet

By Naomi Bloch

On November 5, Navdeep Bains, Canada’s new Minister of Innovation, Science and Economic Development (now that’s a mouthful!) confirmed the rumours that the country’s mandatory long-form census will be reinstated in 2016.

But what are the long-term consequences of the interruption in mandatory data collection caused by 2011’s National Household Survey (NHS)? How significant is this short-lived census change likely to be?

Geothink co-applicant researcher Scott Bell, a professor of Geography and Planning at University of Saskatchewan, has been studying and mapping the spatial patterns of the voluntary National Household Survey data, comparing global non-response rates in metropolitan and non-metropolitan areas across the country. After today’s official announcement, Bell shared a few preliminary thoughts based on his research.

profile photo of Scott Bell

Scott Bell is a professor in the Department of Geography and Planning at the University of Saskatchewan.

Geothink: Now that the mandatory long-form census has been re-instated, is there anything that researchers or others who rely on location-based specifics from census data need to keep mind?

Scott Bell: In my own research I have been relying on 2006 data for much longer than I would have if the 2011 survey had been the long form of the census. The NHS misrepresents different parts (and types of parts) of the country. In my analysis of 15 Canadian cities, there were lower response rates (measured by non-response) in places with low income, aboriginal populations, new immigrants, and lower rates of education. This is quite troubling since the only solution Stats Canada had at their disposal was over sampling in such areas, which might exacerbate the bias.

Geothink: Did you find that your own recent research was impacted by the 2011 data, and are there likely to be any long-term implications for researchers, given that just one survey period was affected?

Scott Bell: Yes, I was compelled to use long-form data from 2006. It is a relief that we will have a return of this data for 2016. I have always appreciated Canada’s five-year census cycle and a 10-year wait is going to be OK, this once. But there will be a persistent problem trying to understand our society between 2011 and 2016 that won’t be true of another five-year period. Our understanding of economics, household mobility, finances, and structure, immigration, education, etc. for the period from 2011 to 2016 is diminished.

Geothink: Are there any important considerations to keep in mind, for those integrating data from 2011 and other periods?

Scott Bell: In work I hope to publish in the next six months, patterns of response (actually non-response) and what social and economic variables predict this non-response will be elucidated. The next step might be the development of tools to adjust NHS values in order to make the data collected more reliable. The most important step in this direction will be the collection of the long form in 2016; that data will be useful in establishing estimates of what 2011 values are valid and perhaps allow for the setting of “correction factors” for egregious rates of non-response.

Stay tuned for more detailed insights from Scott Bell on location-specific considerations of the National Household Survey data, coming soon to Geothink.ca.

If you have thoughts or questions about this article, get in touch with Naomi Bloch, Geothink’s digital journalist, at naomi.bloch2@gmail.com.