Tag Archives: Geolive

On the Hunt for Social Justice and Empowerment

By Logan Cochrane, Mark Gill, Jon Corbett

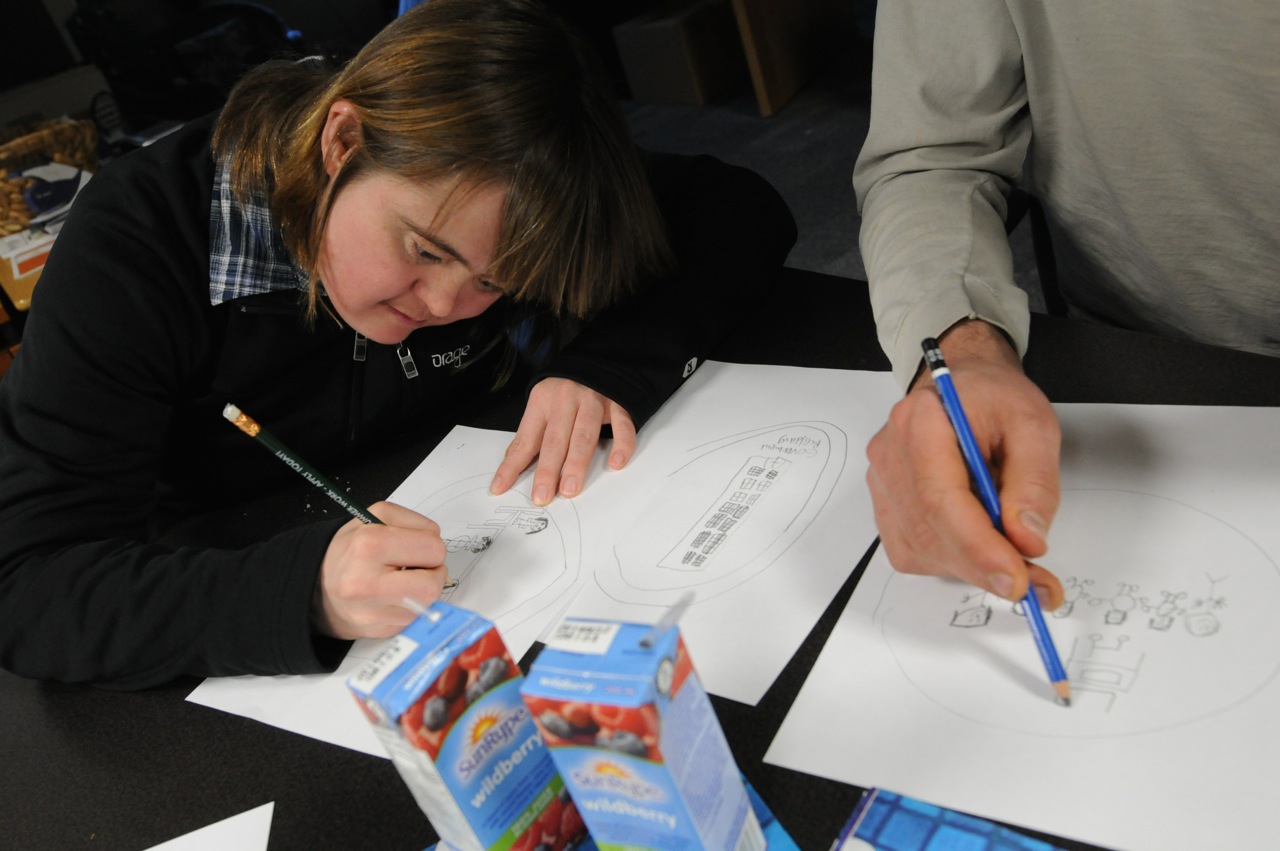
The participatory geoweb has the potential to transform relations of power – who contributes and names places, what is excluded and labeled. This transformation can occur through newfound opportunities for engagement and giving voice to spatially relevant issues. In the 1990s, GIScience recognized this potential and made explicit the importance that social issues would, and should take within the discipline and practice. Geothink did likewise, making social justice one of its key themes. While Web 2.0 and the geoweb has promised greater forms of equality, particularly through supporting user generated content, we know that maps remain value-laden, and are embedded with particular power relations that are not necessarily equally distributed. Social justice is a term that describes the equitable distribution of resources, opportunities, and privileges within society. Amidst the Web 2.0 enthusiasm, we were interested in how issues of social justice are being addressed within the context of the geoweb in academic literature. You might be surprised what we found.

We first set out to take stock of the current state of GIScience literature (Cochrane et al, 2016). Using the ten most highly ranked academic journals by GIScientists. We assessed ten years of literature. We narrowed the more than 14,000 articles published from 2005 to 2014 to those having some relationship to the geoweb and/or crowdsourcing, using broad and inclusive terms. Of the resulting sub-set, we searched for social justice, and terms related to it, for example empowerment. We found that only three articles engaged explicitly with social justice . Even more surprising, terms related to social justice (empowerment, marginalization, social change, environmental justice, spatial justice, etc), were limited to the marginal periphery of these top tier journals. In other words, these ideas tended not to be the main content of the research. We argue that GIScience runs the risk of missing important insights , as mapmakers around the world are engaged in practice, but ignored in top tier GIScience journals.

Finding that social justice was more likely to be a footnote than a substantial focus of the research endeavour or engagement, we then wondered about empowerment. We had searched for it in the original article, but wanted to expand the search (adding ten more years of journals, 1996-2014, and using an open search rather than specific journals) and go into more detail (Corbett, Cochrane and Gill, 2016). Empowerment is of particular interest for GIScience because so many assume the use of the participatory geoweb results in empowerment. While the usage of the term has increased with time, the concept was consistently ill-defined and insufficiently measured. Amazingly, almost one quarter (24%) of the articles that mentioned “empowerment” were not included in the main text, but in places such as the works cited list or an endnote. Even of those that did engage with the concept in a substantial way, only a minority defined the term, fewer still explained how they measured it, and only five listed the specific metrics. We argue that researchers should make a greater effort to adequately define what they mean by “empowerment” and provide a way to actually assess how projects are providing that particular empowerment.

These two papers act as key reference points for those interested in the participatory geoweb. While our papers do not negate the potential for positive impacts, they highlight the fact that research commonly does not engage with social justice, and when terms like empowerment are used, they are often not defined or cannot justify claims of positive impact. As Web 2.0 technologies encourage people to take part in creating knowledge, through maps or otherwise, we need researchers to study how participatory and crowdsourcing approaches to map making intersect with issues of social justice. Based on these findings, we hope to draw attention to this important aspect of GIScience which has long been identified as a crucial area of research.

Dr. Corbett's research team are tackling issues of empowerment via the geoweb and have developed tools such as GeoLive

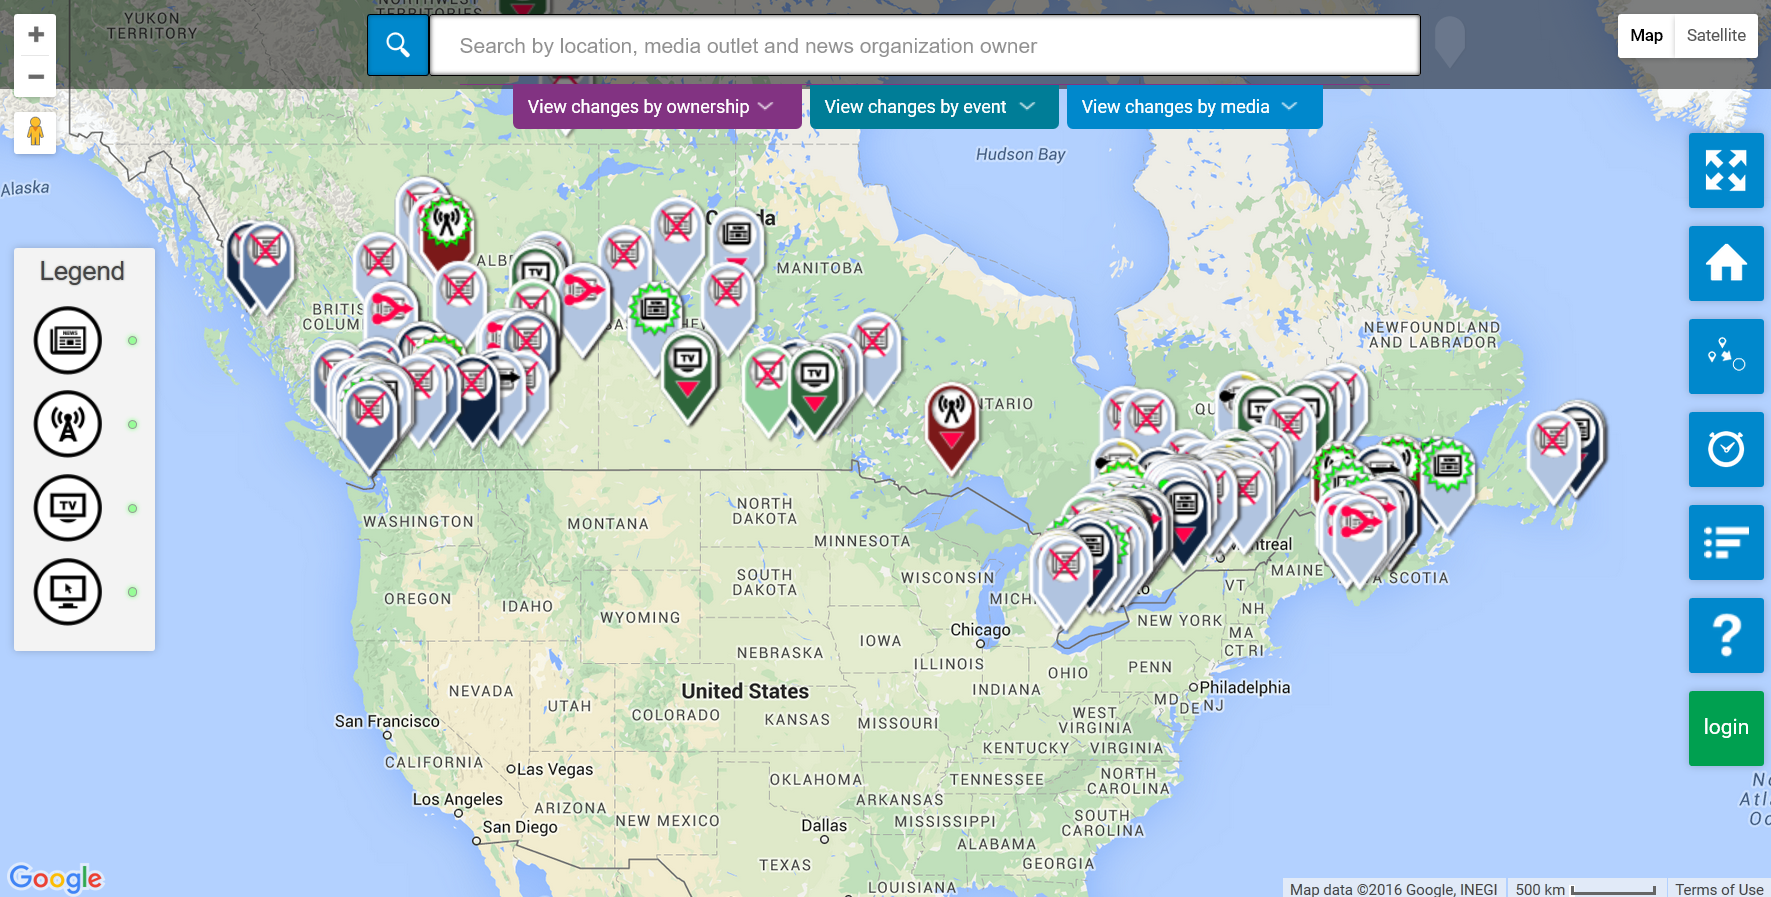
Dr. Corbett’s research team are tackling issues of empowerment via the geoweb and have developed tools such as GeoLive

For more information, see the two papers this post was based on:
Cochrane, L., Corbett, J., Evans, M. and Gill, M. 2016. Searching for Social Justice in GIScience Publications. Cartography and Geographic Information Science http://dx.doi.org/10.1080/15230406.2016.1212673

Corbett, J., Cochrane, L. and Gill, M. 2016. Powering Up: Revisiting Participatory GIS and Empowerment. The Cartographic Journal http://dx.doi.org/10.1080/00087041.2016.1209624

Local News Map Will Be First To Highlight Disparities in Coverage Across Canada

The Local News Map launched by Geothink Co-Applicant Jon Corbett and Partner April Lindgren asks Canadian communities to report how news coverage has changed for them.

The Local News Map launched by Geothink Co-Applicant Jon Corbett and Partner April Lindgren asks Canadian communities to report how news coverage has changed for them.

By Drew Bush

The impact of newsroom cutbacks, consolidations, and closures across Canada will be the focus of a new crowdsourced online geoweb map. The public can contribute to it now—with the full map available online this June.

“The idea of the map is it will allow us to gather data that we have not been able to gather on our own just because there is so much data out there,” said Geothink Partner April Lindgren, an associate professor at Ryerson University’s School of Journalism and founding director of the Ryerson Journalism Research Centre.

The project stems from a belief that Canadians who live in smaller cities, suburban municipalities, and rural areas typically have fewer media outlets to turn to for media coverage. For that reason, the project’s list of communities includes municipalities that have experienced a major disruption in local news sources (such as the closure of a daily newspaper or television station).

The map will be one part of the project “Election News, local information and community discourse: Is Twitter the new public sphere?” that is headed by Jaigris Hodson, an assistant professor of Interdisciplinary Studies at Royal Roads University. Geothink Co-Applicant Jon Corbett, an associate professor in Community, Culture and Global Studies at the University of British Columbia, Okanagan, helped design it with his graduate students in the Spatial Information for Community Engagement (SPICE Lab) using the GeoLive platform featured in previous Geothink research.

“What we did is we went back to 2008 and we tried to find all the instances where a local news organization had either closed or scaled back service or something new had been launched,” Lindgren said in March while the map was being developed. “And so we populated the map as much as possible with information that we could find. But obviously there is lots and lots of other information out there that has happened since 2008. And there is probably lots of stuff going on right now that we do not know about.”

“So the idea of the crowdsourcing is it will allow us to obviously draw upon the expertise and knowledge of the local news landscape of people who live in communities,” she added. “And they will be able to contribute those pieces of information to the map to make it more robust and comprehensive.”

The map can document gains, losses, service increases, and service reductions at local online, radio, television and newspaper outlets across the country. Now that the map is open to contributions, members of the public can add information about changes to the local news landscape in their own communities. The map’s administrators will verify user submitted content so that the map remains accurate.


For a closer look at this project and the map, check out our video. In it, Corbett walks the user through a step-by-step view of the map and how to contribute while Lindgren discusses the importance of this work.


Making the Map

Many researchers have looked at the critical information needs of communities on topics such as education, health, security and emergency responses, Lindgren said. This in turn led her to think about how we know if there is adequate media provision in Canadian communities and where media have been lost or added. Still another related question is what online local news sites or social media have sprung up to fill any missing gaps.

Through attendance at last year’s Geothink Annual General Meeting in Waterloo, Lindgren was put in touch with Corbett. Eight months later, they had created a beta version of the map that included a couple hundred entries. Some emerging trends in the data include the consolidation and closure of community newspapers in Quebec and British Columbia.

“April had this idea that she wanted to better communicate information about how news media had changed over the period of the last eight years or so in Canada,” Corbett says of his meeting last May with Lindgren that began work by his lab to develop the map. “Because there really has been a lot of activity. Some newspapers have gotten larger. Others have closed down. There is a general move to web based media.”

His group has spent months ironing out the technical details of making this map presentable and ready for launch. Lindgren has provided feedback and advice on it through each stage.

“It has been an awful lot more complicated than we originally intended precisely because there has been so much activity and there is so much difference in this type of activity across Canada,” Corbett added. “For example, we have four major types of media. We have newspaper, we have radio, we have TV, and we have the web. And then within each one of those different types, we have a whole series of other information we need to convey.”

For example, the newspaper category of the map alone contains free dailies, free weeklies, and paid newspapers. It also must contain a measure of how such types have either declined or increased in different localities through time.

“And so we see all of this sort of compounding levels of complexity around the data that we need to present,” he said. “Because of course one of the problems with maps is to present information in an effective way require an awful lot of thought about the types of information being presented and how you actually present that type of information. It needs to be beautiful, it needs to be engaging, but it also needs to be informative.”

Corbett’s group has used color, typography, and more to make the map easily accessible to users. But he notes it is still a challenge to display all the transformations from January 2008 to the present. And the issue of time—as it is portrayed in the map—will only become more important as users begin to use it to display events taking place during specific years.

Getting Involved

Lindgren and Corbett are both excited for the map’s launch and the public’s participation. Right now the map needs richer input on new online news sites launched in Canada, Lindgren said. This is an issue she plans to keep an eye on when users begin contributing in greater frequency to determine to what extent these organizations are viable and fill gaps left by the closure of local newspapers and television stations.

Lindgren also believes the map has wide appeal to specific communities including local governments, individual community members, and journalists. She points out that in coming weeks there is a number of ways for the public to get involved.

“First of all, when they add a piece of data, they can comment,” Lindgren said. “Or they can comment on any other developments on the map that they want. And we have also incorporated a survey so that people can fill out the survey and tell us a little bit about where they go for their local news. Whether they feel adequately informed about various topics ranging from politics to education to other local issues.”

In case you missed it in the links above, find the map here to contribute your information: https://localnewsmap.geolive.ca/

###

If you have thoughts or questions about the article, get in touch with Drew Bush, Geothink’s digital journalist, at drew.bush@mail.mcgill.ca.

Mapping Inclusive Employment: Community Engagement on the Participatory Geoweb

Project partners exploring the interactive map

Participants were asked to draw pictures representing the five stakeholder groups. The drawings formed the basis for the icons used on the map markers. Photo courtesy the SpICE Lab (Spatial Information for Community Engagement)


By Naomi Bloch

In British Columbia, researchers have been using a crowdsourced mapping tool to capture positive employment experiences of individuals with intellectual disabilities. Geothink co-applicant Jon Corbett, an associate professor at the University of British Columbia’s Okanagan campus, is one of several UBC contributors to the participatory research project. Recently, the group published findings from its two-year pilot program.

The project is a collaboration between government agencies, the University of British Columbia, as well as self-advocates with intellectual disabilities and community partners. It demonstrates how government and citizens can employ the geoweb and participatory mapping to address community issues. “What we wanted to do specifically,” said Corbett, “was create a crowdsourced tool that would enable people to share their positive experiences, so that other people with intellectual disabilities and their family members and employers and also service providers could come to the site and they could actually see examples of positive employment. And so then they could emulate that, and they could strategize around that.”

This required developing an online environment that could engage all the identified stakeholder groups. To accomplish this, the initiative turned to the GeoLive participatory mapping tool, developed by Corbett’s Spatial Information for Community Engagement (SpICE) Lab. The GeoLive platform is a key component of a number of Geothink partner projects.

According to Corbett, GeoLive was initially conceived as a means to better support excluded and marginalized populations. “We know that when we share information on the cloud we have no idea how that information will be re-purposed, re-used, or stored,” Corbett said. “It can reappear in ways where we might least expect it in the future. So we wanted to get away from that and provide a certain level of guarantee that the information that people shared through the map is actually uniquely stored on our own servers, and should they wish to delete it they can delete it and it will be deleted forever.”

Corbett and GeoLive programmer Nick Blackwell are able to work directly with community members to customize the platform based on user needs. The software, which is built around the familiar Google Maps API,  is now used both by community groups as well as academic researchers. In the process of working with their inclusive employment partners, Corbett and his colleagues gained new insights regarding some of the usability challenges on the participatory geoweb. These included spatial literacy issues, the need to make the platform more mobile-friendly and less reliant on keyboard interaction, as well as accommodating users who have limited familiarity with today’s social media conventions.

Self advocates with intellectual disabilities and other stakeholders collaborated with Corbett’s team to design, evaluate, and further customize the online mapping tool. The group then worked with individuals and organizations throughout the province to collect stories of successful and inclusive employment. Over eighty narratives are now included on the map. While some markers have simple text descriptions, others include video, audio, as well as photos.

The map now serves as a shared space for community engagement. At the same time, university researchers associated with the project have been able to analyze the collected stories to identify some of the common features described in participants’ positive employment experiences. Map contributors discuss issues such as the challenges of finding a job, as well as the social and practical factors that create an enriching work environment. These findings are expected to help inform best practice guidelines that can support employment services for people with intellectual disabilities in the future.

The map is now public, and anyone can contribute their own relevant experiences or explore other people’s stories at http://www.mappinginclusiveemployment.ca/.

Reference: Hole, R., Corbett, J., Cook, S., & de Raaf, S. (2015). Mapping inclusive employment practices for individuals with developmental disabilities: A participatory research mapping project. The BC Centre for Employment Excellence, 32 pages.

If you have thoughts or questions about this article, get in touch with Naomi Bloch, Geothink’s digital journalist, at naomi.bloch2@gmail.com.

Mapping to Empower Excluded Populations with Jon Corbett at University of British Columbia

Jon Corbett is an associate professor in the University of British Columbia's Community, Culture and Global Studies program and co-director of the Centre for Social, Spatial and Economic Justice.

Jon Corbett is an associate professor in the University of British Columbia’s Community, Culture and Global Studies program and co-director of the Centre for Social, Spatial and Economic Justice.

By Drew Bush

In our daily usage, most maps contain a logical representation of a city’s streets or a forest’s hiking trails that allows us to safely navigate to new locations. For many indigenous and excluded populations, maps can play a more fundamental role.

Jon Corbett, an Associate Professor in Community, Culture and Global Studies at the University of British Columbia, has spent decades investigating how cartographic processes and tools used by local communities help express their relationships to and knowledge of land and resources. Corbett has worked in Australia, Indonesia, the Philippines, and in British Columbia with several First Nations communities.

“Often maps, although they are powerful tools, they don’t tell the full story because a lot of indigenous knowledge and a lot of local knowledge is tied up in storytelling, and histories, and is built around specific landmarks within a particular town within a particular place,” he told Geothink last June.

To better capture this relationship with the land, Corbett and his graduate student Nicholas Blackwell first began building their Geolive platform in 2008. Geolive is an online interactive mapping interface based on the Google Maps API that allows administrators to create public maps and place user-generated information on those maps while users can add content and communicate.

In other words, users of this platform can add attributes to specific locations on the map using text, photos, video or other media to show how specific places get used by the community. As the platform has gotten more sophisticated, users have gained the ability to moderate each other, filter info with key words, and use mobile devices to contribute short videos or photos.

The most important element is that users take ownership of the place they live and contribute important local knowledge. Corbett got his start doing this type of work before programs such as Google Earth existed. In fact, he literally used sticks, sand and stones when he began thinking about how to empower often excluded communities with maps during his Ph.D. research in Borneo.

“I am really interested in how maps can become transformative agents in change, particularly social change,” he said. “So my research in the past has involved working with a lot of excluded populations, often indigenous population in different places in the world. Looking at how mapping can become a tool to express a different relationship, or a different set of experiences, or a different set of stories as it relates to that particular group and the land on which they live.”

His work has evolved from using sketch mapping where participants draw rivers, streets, and watershed boundaries from memory to scale mapping where they add or fill in locally-based information on scale maps or three-dimensional modelling where participants build a physical, tactile terrain map. Of the digital, he comments that some elements can be lost from a process that once involved using what was on the ground.

“There is this funny thing that occurs as you move from more tactile, more tangible forms of participation mapping into the digital world,” he said after enumerating the many advantages of digital mapping with communities. “In a sense, your own relationship to those types of projects diminishes as you become more virtual.”

If you have thoughts or questions about this article, get in touch with Drew Bush, Geothink’s digital journalist, at drew.bush@mail.mcgill.ca.

Making Waves

Making Waves: Developing, Testing and Deploying a Smart Phone App to Share Examples of Good and Poor Water Conservation in the Okanagan Valley, British Columbia by Prof. Jon Corbett

Here at the University of British Columbia, Okanagan Campus, we have just hired two students, Andrew Barton and Emily Millard, to work on the Geothink project. They are being co-financed by Geothink and the British Columbia Work Study program. Together with our SSHRC partner, the Okanagan Basin Water Board, and a new partner, the Okanagan Science Centre, we have co-developed a proposal that we have submitted to the Real Estate Foundation of British Columbia entitled “Making Waves: Developing, testing and deploying a smart phone app to share examples of good and poor water conservation in the Okanagan Valley.” We are proposing to work directly with youth (age 10 -13) in the North and Central Okanagan to co-design and develop a mobile application that will allow members of the public to share photographs and short commentaries of good and poor water conservation. The app will work in conjunction with existing web-based mapping software (http://geolive.ca) that we developed for a prior grant; it also will include discussion tools. The resulting information, displayed on a website, will make this volunteered information accessible to the general public as a means to make them more aware of water conservation in the valley and provide them with a direct medium through which to engage with this issue.

The Okanagan has among the highest per capita water demands and lowest per capita water supplies in Canada. The environment is semi-arid, and the southern portions of the watershed include Canada’s only designated desert.  Research conducted by Dr. Stewart Cohen and other scientists at UBC and partner institutions have projected serious impacts of climate change on the Okanagan water supply. Yet, the sense among the general public and visitors is that the valley is rich with water. One of the greatest challenges faced by the Okanagan Basin Water Board (OBWB) is to make people more aware of the increasing need to conserve water. As a result OBWB has developed the Okanagan Waterwise program that has the clear mandate to bring residents of the Okanagan valley together with the understanding that the valley’s water source is connected — and that all residents share the same resource. Hopefully it would increase awareness among valley residents about water issues in the Okanagan, support Okanagan residents in making positive changes in their own water habits that will protect the quality and quantity of the valley’s water, and share ideas about how all the valley’s residents can do something to preserve the unique character of the region.

Our proposed project will bring together three leading organization in the region to directly address these four established, and much needed, objectives. Our proposed project and the Water Conservation app will act as a medium to bring together members from throughout the valley to share their views and perspectives on current water use, to increase awareness of all users of both their own and others use of water; for example users might contribute photographs and their perspectives on xeriscape gardening or low water use public facilities. Through raising this awareness our hope is to support change toward more efficient water use in order to create a more sustainable water management practice in the future.

We welcome your participation in this and other projects, especially since we hope that this project can be generalized to other activities. If you’d like more information or a status report, please email Emily Millard (emilyloumillard@gmail.com), Andrew Barton (andrew@redshift.bc.ca) or their supervisor, Jon Corbett (jon.corbett@ubc.ca)